Okay, let’s break down this bibliometric data and interpret its meaning within the context of research. Given that the data comes from SCOPUS, we can assume a relatively broad coverage across disciplines, though the specific subject area isn’t specified here.
Here’s an interpretation of the provided statistics:
Overall Scope and Growth:
* Timespan: 2021-2025: This is a relatively short timespan (5 years), indicating that the collection represents recent research activity.
* Documents: 206: The number of documents (206) suggests a moderately sized collection. It’s not enormous, but it’s substantial enough to draw meaningful conclusions about the trends within this specific field.
* Annual Growth Rate %: 114.07: This is a *very* high annual growth rate. A growth rate exceeding 100% year-over-year suggests a rapidly expanding field of study. This could be due to several factors:
* Emerging Field: The research area might be relatively new and gaining significant traction.
* Increased Funding: Recent increases in funding or research initiatives could be driving the surge in publications.
* Broader Scope: There might have been a change in the criteria for inclusion in the collection (though unlikely without further information).
* Focus Shift: A shifting focus to the research domain represented by these publications within SCOPUS’s indexing practices.
*It is important to investigate why the annual growth rate is so high. I would advise that a researcher explores the documents more in depth to confirm its accuracy and to investigate what is driving the growth.*
* Sources (Journals, Books, etc): 110: The presence of 110 sources indicates that the research is spread across a decent number of journals, books, and other publication outlets. This suggests the field is not overly concentrated in a few specific publications.
* Document Average Age: 0.995: An average document age of approximately 1 year indicates that the collection is highly current. This aligns with the short timespan and high growth rate. *This reinforces the idea that we are looking at a rapidly evolving field.*
Impact and Citation Patterns:
* Average citations per doc: 5.641: An average of 5.64 citations per document is a moderate citation rate. Whether this is “good” or “bad” depends heavily on the specific discipline. Some fields (e.g., molecular biology) typically have much higher citation rates than others (e.g., some areas of the humanities). It’s important to compare this citation rate to the average for similar research areas within SCOPUS to get a better sense of the collection’s impact. It could signify:
* Recent Research: Due to the documents’ age, citations might still be accumulating.
* Niche Topic: The topic might be specialized, resulting in a smaller audience and fewer citations.
* Variable Quality: There could be a mix of highly cited and less-cited papers within the collection.
* References: 6534: This is the total number of references cited *within* the documents in the collection. It gives a sense of the depth of background research and the extent to which these publications are building upon previous work.
Authorship and Collaboration:
- Authors: 629: A significant number of authors (629) contributing to 206 documents indicates a relatively large research community involved in this area.
- Authors of single-authored docs: 13: The low number of single-authored documents (13) compared to the total number of authors suggests that collaboration is common within this field.
- Single-authored docs: 21: The low number of single-authored documents (21) compared to the total number of documents also suggests that collaboration is common within this field.
- Co-Authors per Doc: 4.18: An average of 4.18 co-authors per document confirms the collaborative nature of the research. This suggests that research projects in this area often require diverse expertise or larger teams.
- International co-authorships %: 21.36: The presence of 21.36% international co-authorships suggests a moderate level of global collaboration. This indicates that the research area is attracting interest from researchers in different countries, potentially leading to cross-cultural knowledge exchange and diverse perspectives.
Document Types:
* Article: 68, Book Chapter: 11, Conference Paper: 106, Conference Review: 8, Note: 1, Review: 12: The distribution of document types reveals the following:
* Conference Papers are Prominent: The high number of conference papers (106) suggests that conferences play a significant role in disseminating research findings in this field, especially given the total number of documents. This might indicate a fast-moving field where early results are often presented at conferences before formal journal publication.
* Articles are Substantial: Articles also forming the majority of the documents.
* Reviews and Book Chapters: Suggests that some researchers are engaging with synthesizing the current information.
Keywords:
- Keywords Plus (ID): 952, Author’s Keywords (DE): 481: This shows there are many keywords associated with the papers. The large amount of `Keywords Plus` suggest that the collection is interdisciplinary. `Keywords Plus` are generated by SCOPUS, so they are outside of the author’s control.
Overall Interpretation and Further Questions:
Based on these statistics, we can infer the following about the research area represented by this collection:
- Rapidly Growing Field: The high annual growth rate, recent timespan, and young document age point to a field that is experiencing a surge in research activity.
- Collaborative Research: The high co-authors per document ratio and low number of single-authored documents indicate a strong emphasis on collaboration.
- Moderate Citation Impact: The average citations per document is moderate, but needs to be compared to field-specific benchmarks.
- Conference-Driven Dissemination: Conferences play a significant role in sharing new findings.
- Global Collaboration: There is a noticeable level of international collaboration, suggesting a global research community.
Further Questions for the Researcher:
To gain a deeper understanding, consider exploring the following questions:
1. What is the specific subject area of this collection? Knowing the specific research topic is crucial for interpreting the citation rate and understanding the context of the findings.
2. What are the top journals and conferences represented in the collection? This will reveal the key publication venues in the field.
3. Who are the most prolific and highly cited authors in the collection? Identifying key researchers can provide insights into the leading figures and their contributions.
4. How does the citation rate compare to the average for similar research areas in SCOPUS? This will help benchmark the collection’s impact.
5. What are the main themes and research trends emerging from the keywords? Analyzing the keywords will reveal the key topics and emerging areas of interest.
6. What’s driving the high annual growth rate? Investigate specific events, funding initiatives, or breakthroughs that might be contributing to the rapid expansion of the field.
7. What does the trend in document types suggest about the field? For example, if review articles are on the rise, it might signal a maturing field.
By addressing these questions and delving deeper into the data, you can gain a more nuanced and comprehensive understanding of the research landscape represented by this bibliometric collection. Remember to always contextualize the findings within the specific research area and consider potential limitations of the data. Good luck!
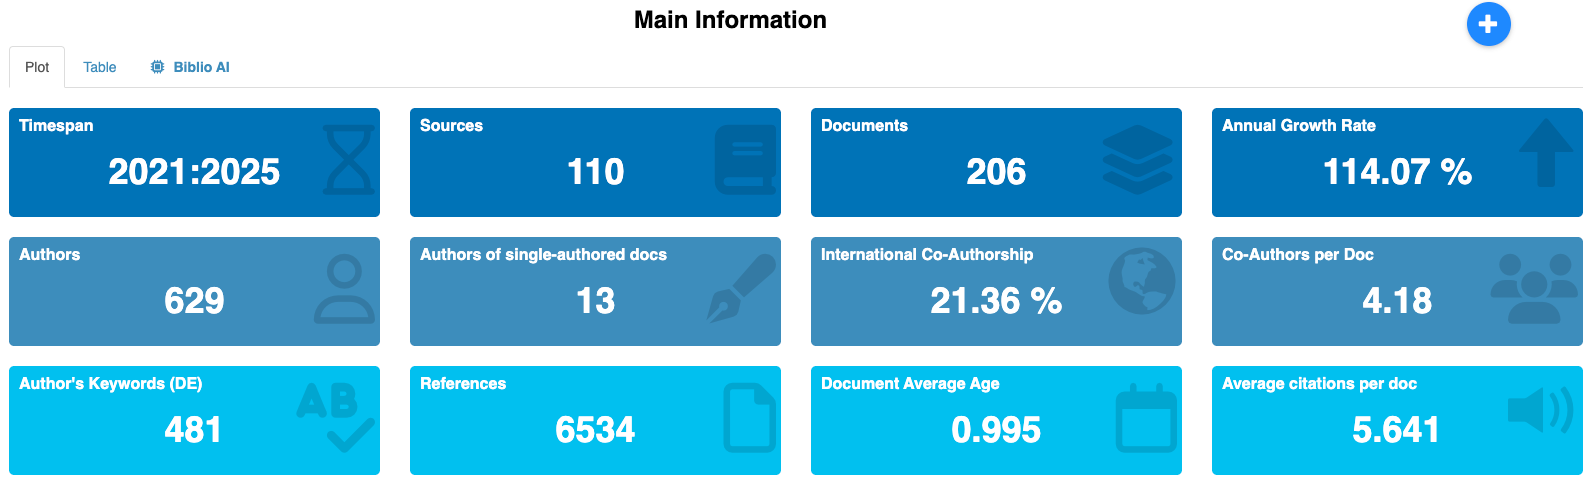
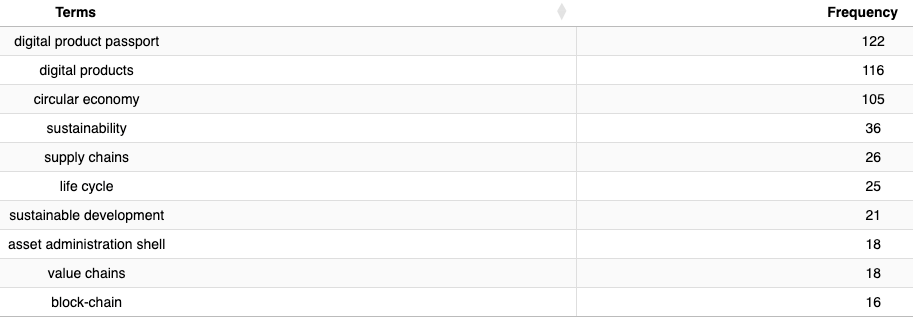
| MAIN INFORMATION ABOUT DATA | |
| Timespan | 2021:2025 |
| Sources (Journals, Books, etc) | 110 |
| Documents | 206 |
| Annual Growth Rate % | 114.07 |
| Document Average Age | 0.995 |
| Average citations per doc | 5.641 |
| References | 6534 |
| DOCUMENT CONTENTS | |
| Keywords Plus (ID) | 952 |
| Author’s Keywords (DE) | 481 |
| AUTHORS | |
| Authors | 629 |
| Authors of single-authored docs | 13 |
| AUTHORS COLLABORATION | |
| Single-authored docs | 21 |
| Co-Authors per Doc | 4.18 |
| International co-authorships % | 21.36 |
| DOCUMENT TYPES | |
| article | 68 |
| book chapter | 11 |
| conference paper | 106 |
| conference review | 8 |
| note | 1 |
| review | 12 |
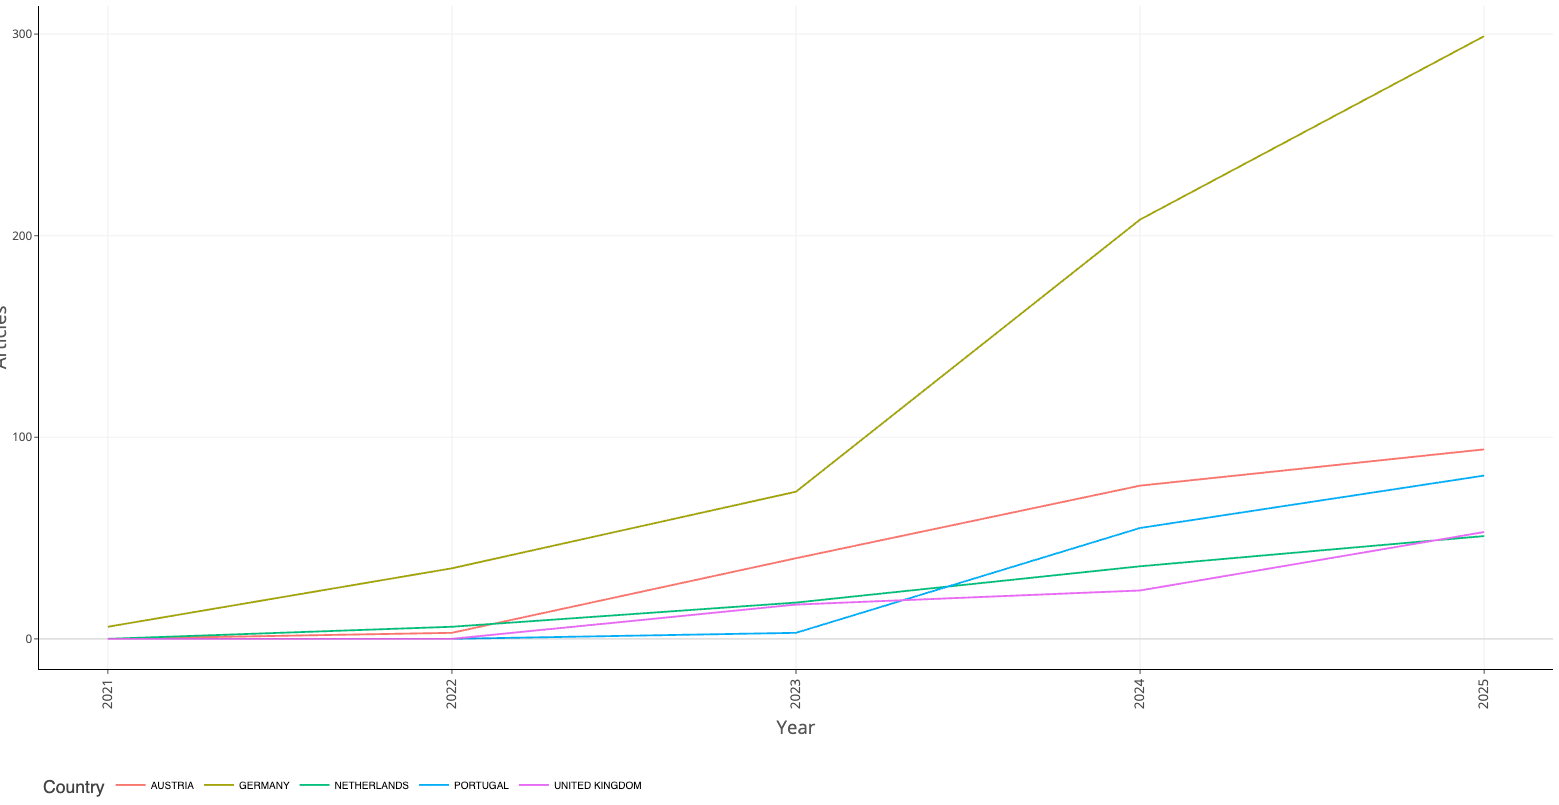
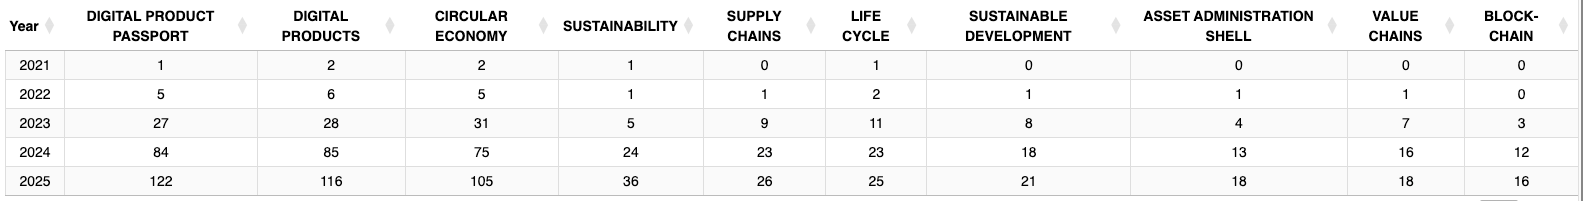
Annual Scientific Production
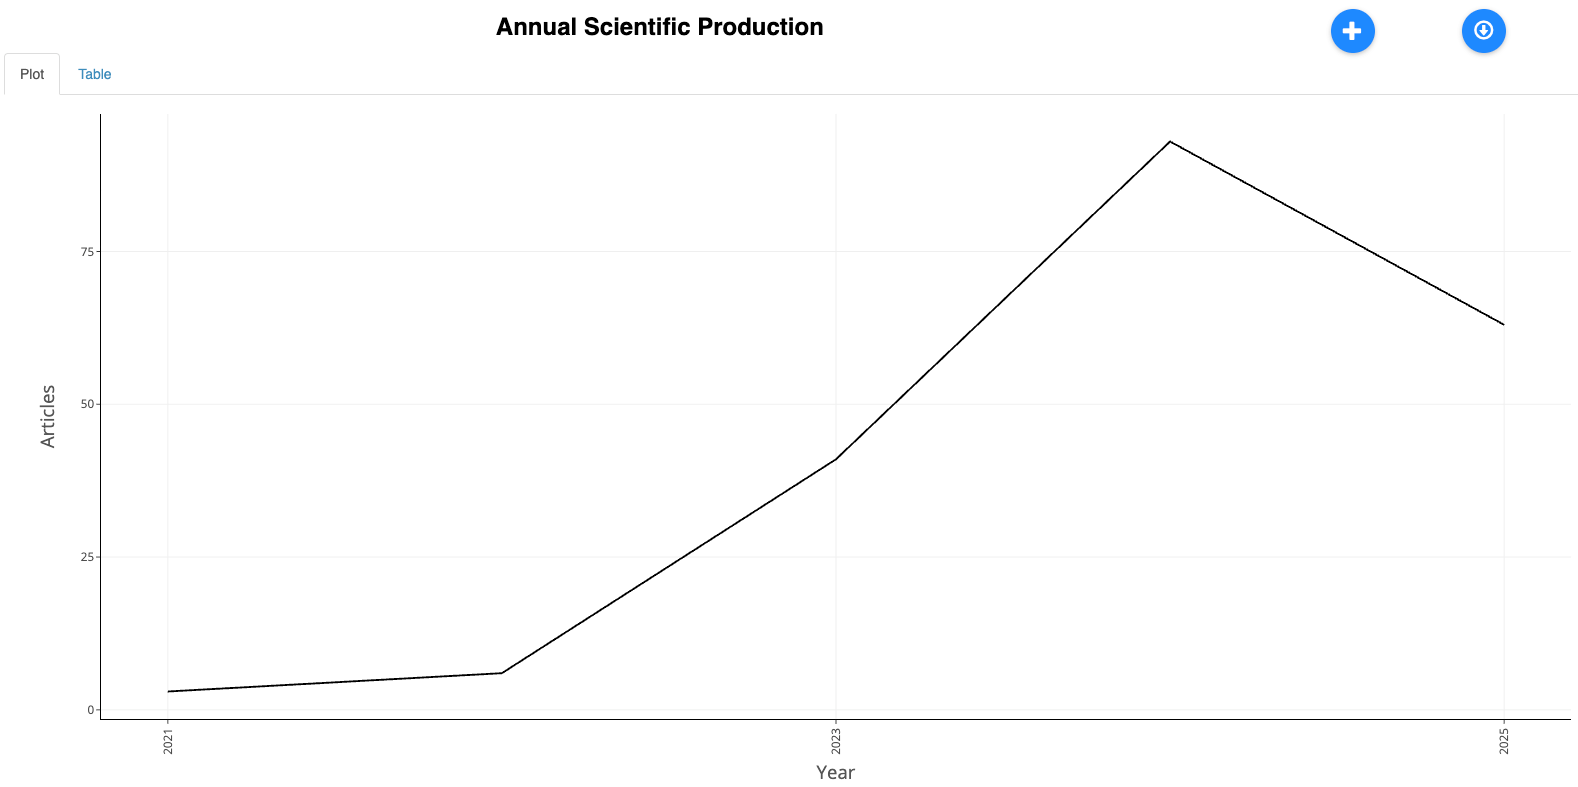
Year and Number of Articles
| 2021 | 3 |
| 2022 | 6 |
| 2023 | 41 |
| 2024 | 93 |
| 2025 | 63 |
Three-Field Plot
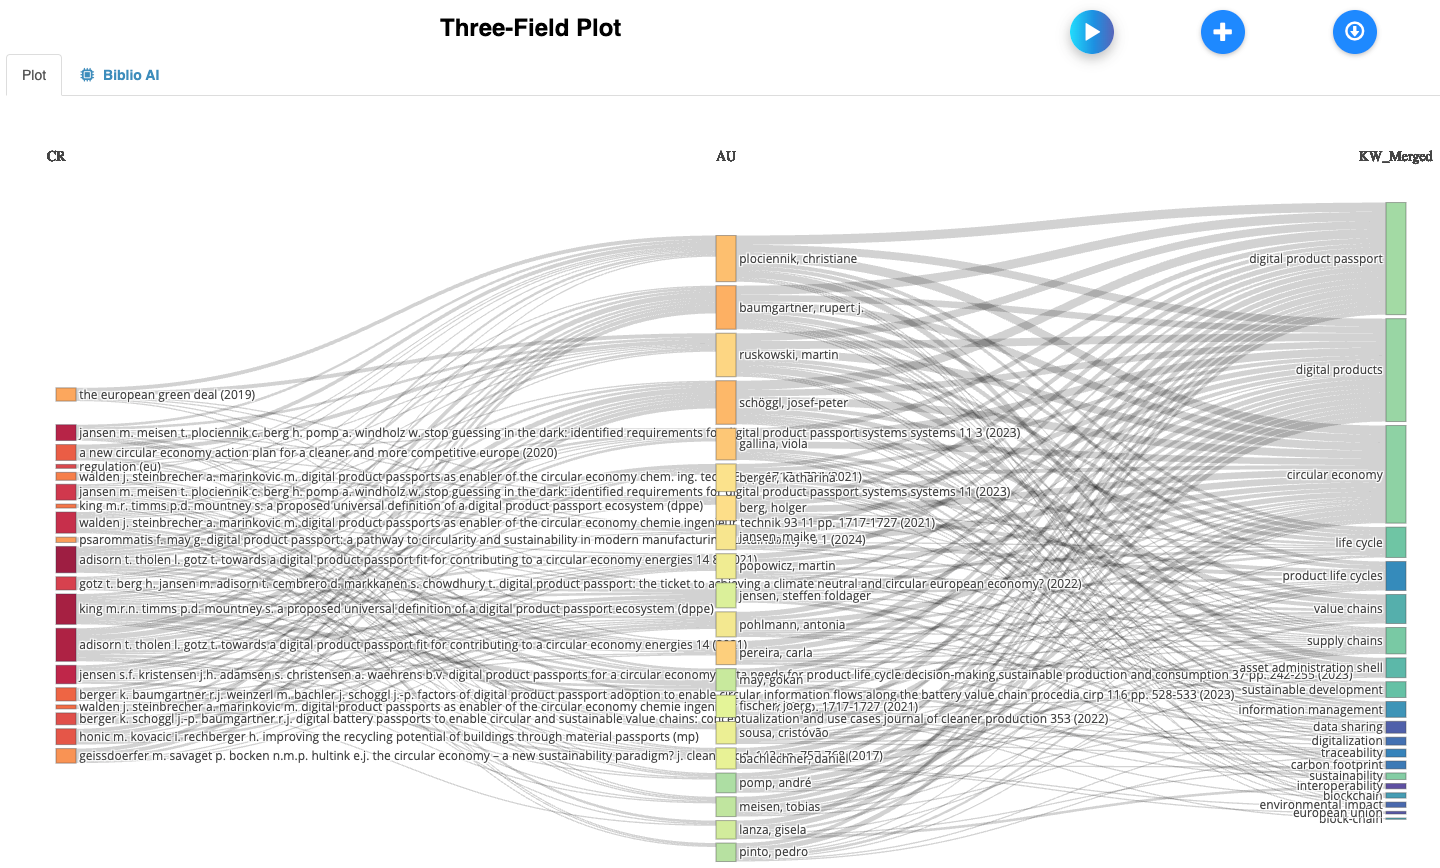
Overall Structure and Interpretation
The plot represents a network of connections, where the width of the connecting flows indicates the strength or frequency of the association between the elements in each field. A wider flow suggests a stronger or more common connection.
Field-by-Field Analysis:
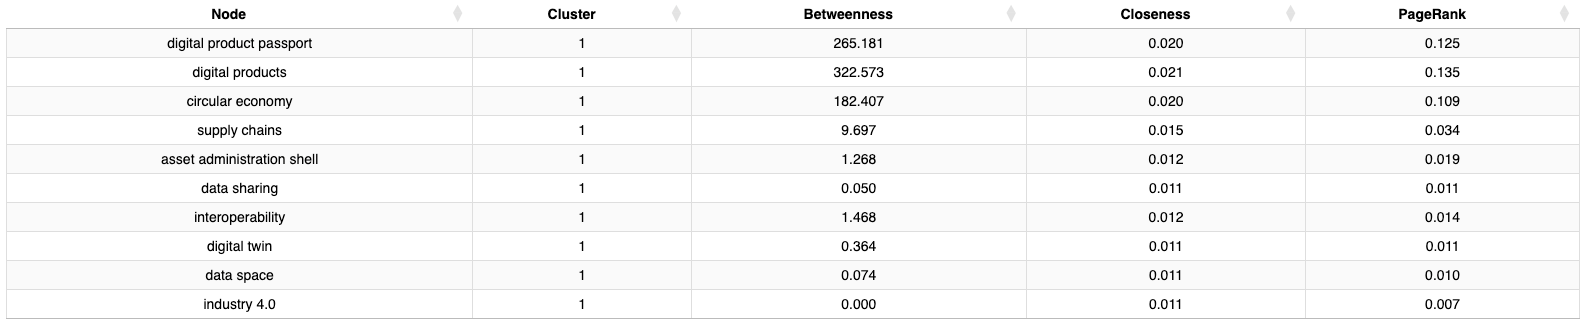
- Authors (AU – Central Field): This column lists the authors in your dataset. The position of each author indicates their relative frequency or importance within the network. Authors with many connections to both Keywords and Cited References are likely more central to the research area being explored.
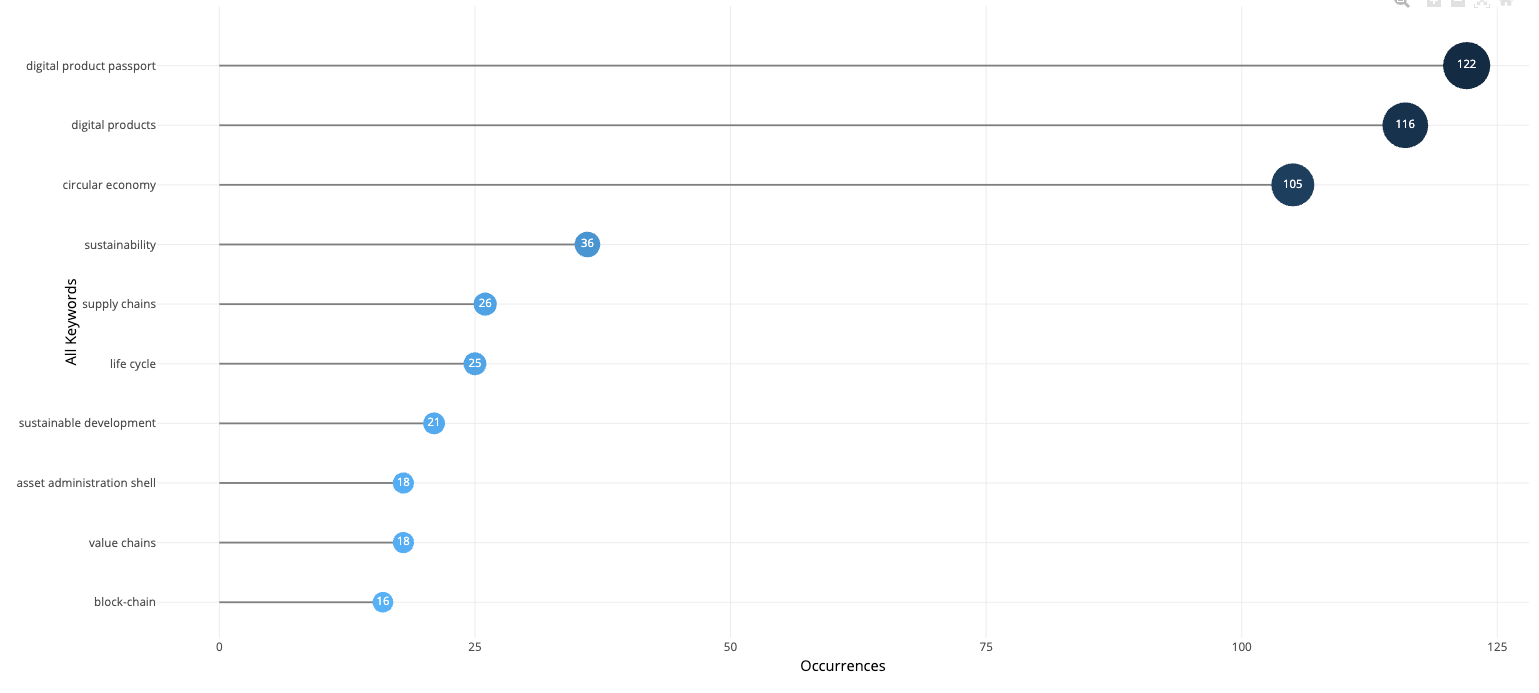
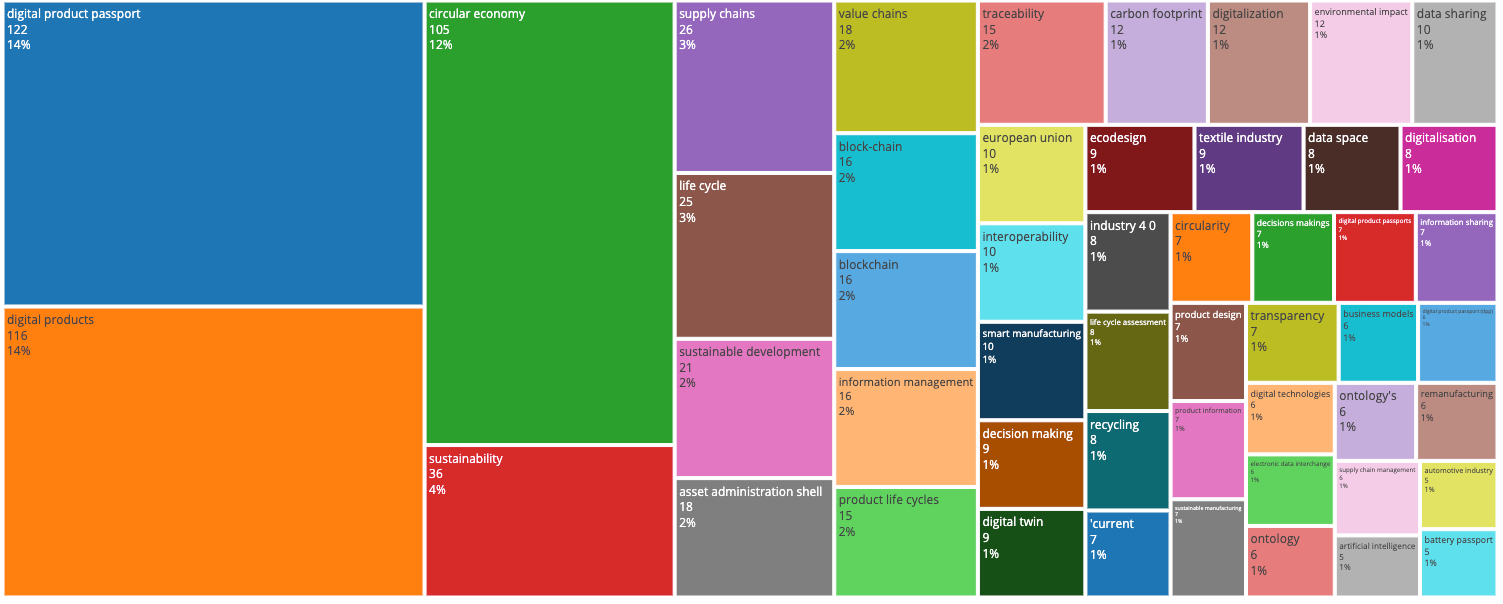
- Keywords (KW_Merged – Right Field): This column shows the keywords associated with the publications. ‘Digital product passport’, ‘digital products’ and ‘circular economy’ seem to be the most prominent keywords. The presence of more granular keywords provides insight into the specific topics covered.
- Cited References (CR – Left Field): This lists the cited references from the publications in your dataset. The labels show the cited authors and the titles of the document. The flow between cited references and the central “Authors” column suggests a relationship with the authors writing on that field.
Key Observations and Interpretation:
1. Dominant Themes: The prominence of ‘digital product passport’, ‘digital products’ and ‘circular economy’ as keywords suggests that your dataset focuses on this intersection. The fact that the authors “plociennik, christiane”, “baumgartner, rupert j.” and “schöggl, josef-peter” are most prominently tied to these keywords indicates that they are key players in that intersection.
2. Key Authors and Influences: Look at which authors in the “AU” field are most heavily connected to specific cited references in the “CR” field. This can reveal which authors are building upon specific prior work or engaging with particular research traditions. For instance, authors highly connected to specific, seminal papers in circular economy or product lifecycle management are likely deeply engaged in those specific sub-areas. The plot highlights the references “walden j. steinbrecher a. marinkovic m. digital product pass”, “jansen m. meisen t. plociennik c. berg h. pomp a. windholz” as important influences.
3. Keyword Clusters: Notice how different keywords cluster together and connect to different authors or groups of authors. This indicates specialized sub-topics or different approaches within the broader research area. For example, some keywords might be related to the technical aspects of digital product passports (e.g., data sharing, traceability), while others are related to the economic or policy implications (e.g., sustainability, circular economy).
4. Bridging Authors: Some authors might connect disparate keywords or cited references, indicating that they are working at the intersection of different areas or are synthesizing diverse perspectives. These authors can be key figures in bridging different sub-fields.
In summary:
This three-field plot provides a visual overview of the intellectual landscape of your dataset. It allows you to identify key authors, dominant themes, and the relationships between them. By examining the connections between cited references, authors, and keywords, you can gain a deeper understanding of the research front in this field and identify potential areas for further investigation.
Most Relevant Sources
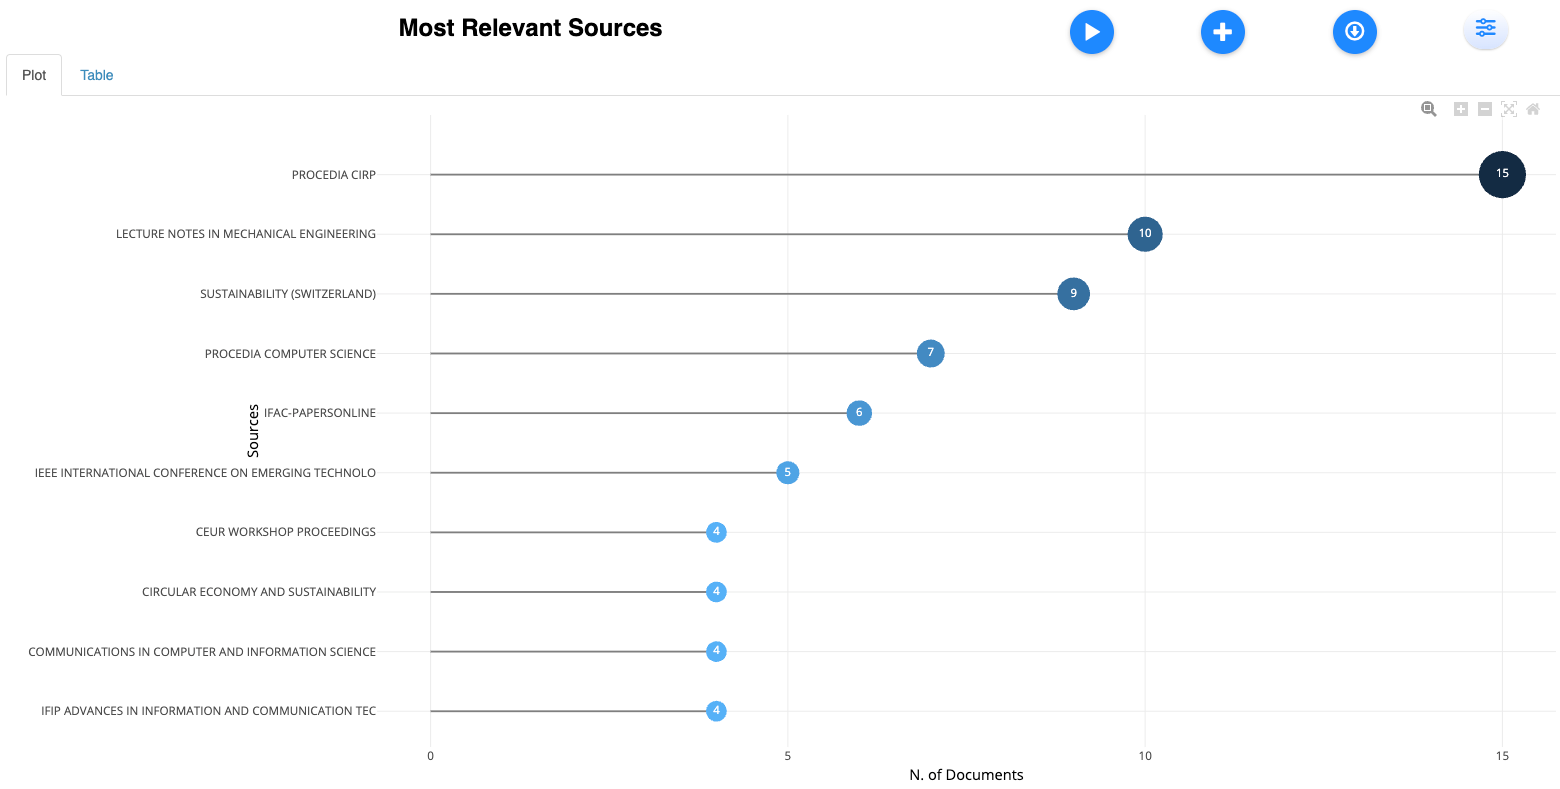
Sources and Articles
| PROCEDIA CIRP | 15 |
| LECTURE NOTES IN MECHANICAL ENGINEERING | 10 |
| SUSTAINABILITY (SWITZERLAND) | 9 |
| PROCEDIA COMPUTER SCIENCE | 7 |
| IFAC-PAPERSONLINE | 6 |
| IEEE INTERNATIONAL CONFERENCE ON EMERGING TECHNOLOGIES AND FACTORY AUTOMATION, ETFA | 5 |
| CEUR WORKSHOP PROCEEDINGS | 4 |
| CIRCULAR ECONOMY AND SUSTAINABILITY | 4 |
| COMMUNICATIONS IN COMPUTER AND INFORMATION SCIENCE | 4 |
| IFIP ADVANCES IN INFORMATION AND COMMUNICATION TECHNOLOGY | 4 |
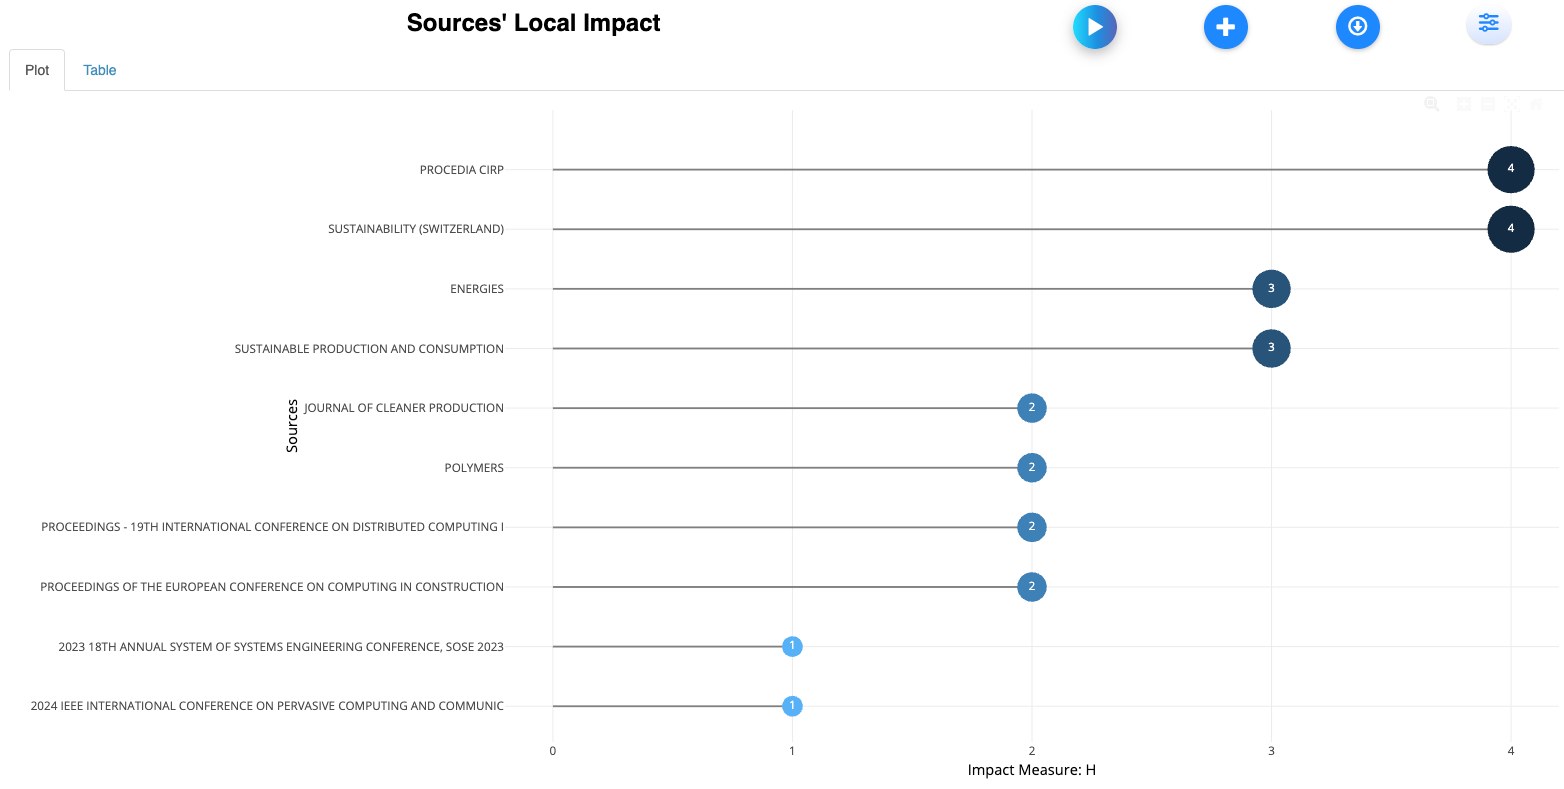
Sources’ Local Impact
Sources’ Production over Time
Most Relevant Authors
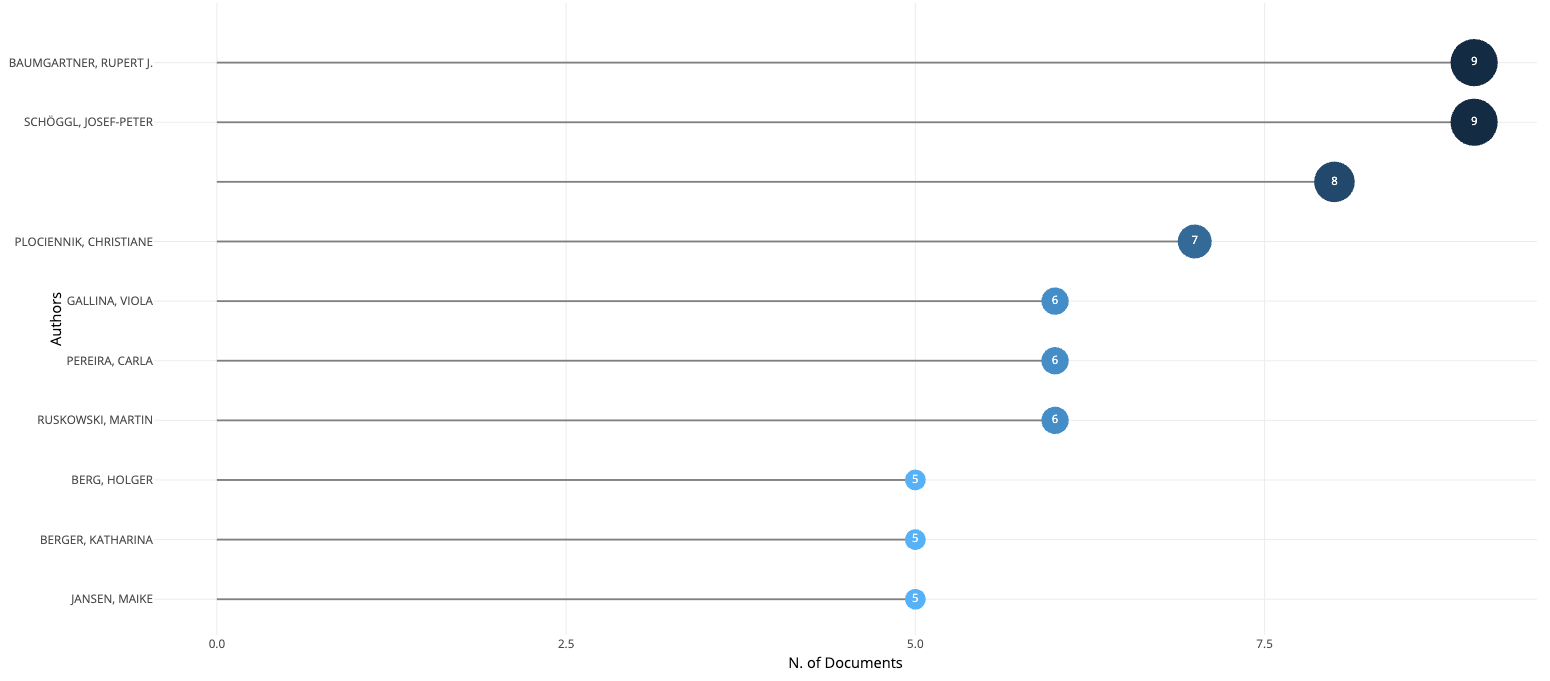
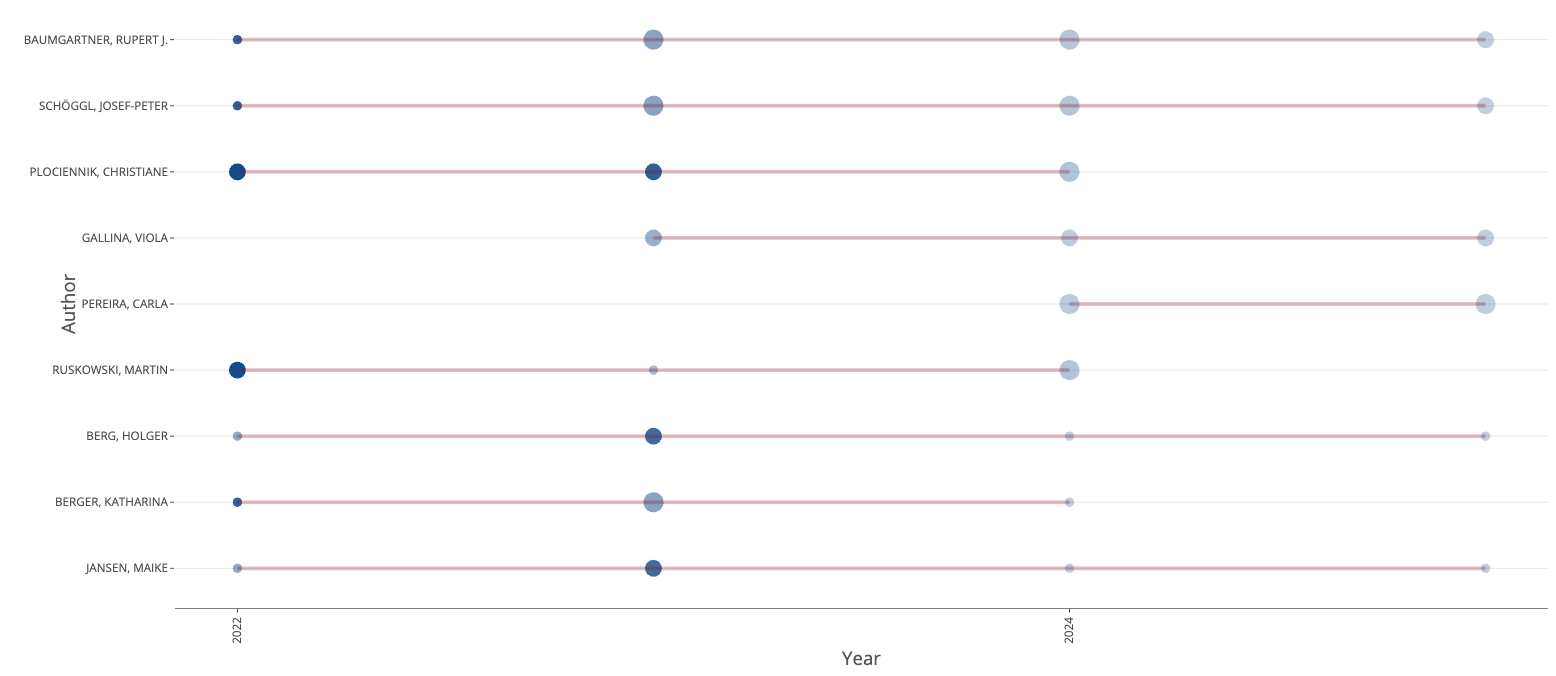
Authors’ Production over Time
Here’s an interpretation of the Authors’ Production Over Time plot, based on the provided information:
Overall Trends
- Emerging Field: The plot suggests that research on this topic (likely related to digital product passports, battery circularity, and sustainable value chains) is relatively recent, with most authors having publications concentrated between 2022 and 2025. The field appears to be gaining momentum.
- Active Authors: Several authors are consistently publishing, indicating ongoing research efforts and contributions to the field.
Individual Author Analysis
- Baumgartner, Rupert J. & Schöggl, Josef-Peter: These authors show a similar publication pattern, they likely collaborate, considering that their top cited article is co-authored. Their highest impact articles (“DIGITAL BATTERY PASSPORTS TO ENABLE CIRCULAR AND SUSTAINABLE VALUE CHAINS: CONCEPTUALIZATION AND USE CASES”) from 2022, has a high citation count (TCpY 25). While their publication output and citations appear high in 2022, they seem to be maintaining a steady interest and contribution to the field.
- Plociennik, Christiane; Berg, Holger; Jansen, Maike: Also in this case these authors show a similar publication pattern and probably are in the same research group or collaborate together. Their highest impact article (“STOP GUESSING IN THE DARK: IDENTIFIED REQUIREMENTS FOR DIGITAL PRODUCT PASSPORT SYSTEMS”) from 2023, has a high citation count (TCpY 20.7).
- Berger, Katharina: Similar to Baumgartner and Schöggl, her most cited article is the same, confirming the collaboration among them.
- Ruskowski, Martin: Ruskowski’s publication rate seems constant between 2022 and 2023.
- Gallina, Viola: Shows activity in 2023 and 2024.
- Pereira, Carla: Started publishing in 2024, with an increase in the number of articles in 2025.
Key Observations & Potential Interpretations
- Digital Product Passports as a Hot Topic: The highly cited papers across multiple authors focus on “Digital Product Passports,” particularly in the context of battery circularity and requirements. This suggests that the development, conceptualization, and requirements gathering for digital product passports are central themes within this research area.
- Collaboration: Co-authorship is evident. This collaborative nature could indicate shared projects, knowledge exchange, and a tightly knit research community.
- Recent Focus: The high concentration of publications and citations in recent years highlights the novelty and growing importance of the topic.
- Conference vs. Journal Publications: Several highly cited articles are from conference proceedings (e.g., *Procedia CIRP*, *Lecture Notes in Informatics*). While these venues can be valuable for disseminating initial findings, it’s important to note that journal publications often undergo more rigorous peer review and might carry more weight in certain academic contexts.
- Scopus Database: The analysis is performed on SCOPUS, it is important to consider the possibility of studies indexed on other databases which are not considered.
Suggestions for Further Research
- Thematic Analysis: Conduct a deeper thematic analysis of the cited papers to identify specific research questions, methodologies, and findings that are driving the field.
- Collaboration Network Analysis: Visualize the collaboration network among these authors to understand the structure and dynamics of the research community.
- Longitudinal Study: Track the publication and citation patterns of these authors over a longer time frame to observe how their contributions evolve and influence the field.
By considering these interpretations and suggestions, you can gain a more comprehensive understanding of the research landscape surrounding digital product passports, battery circularity, and sustainable value chains. Remember to always critically evaluate the data and consider potential biases or limitations in the analysis.
Authors’ Local Impact
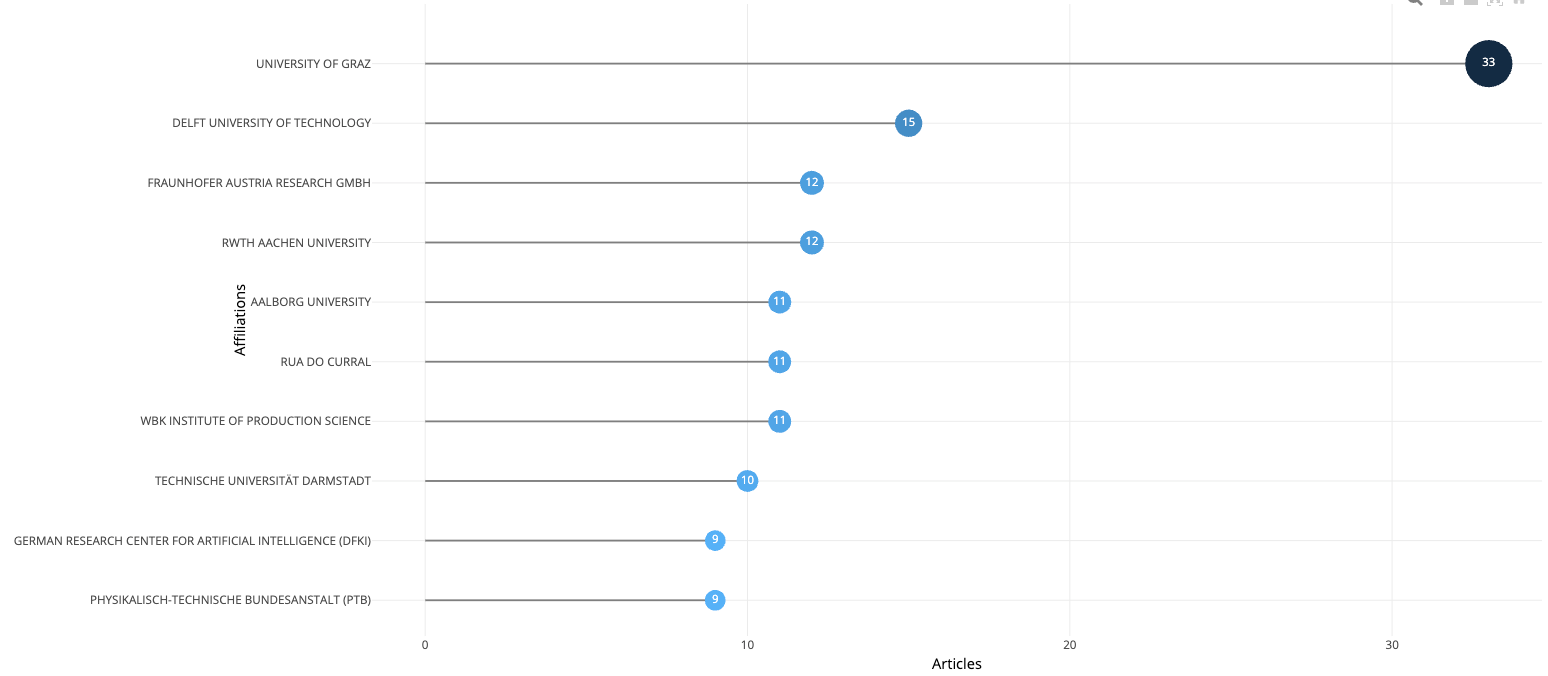
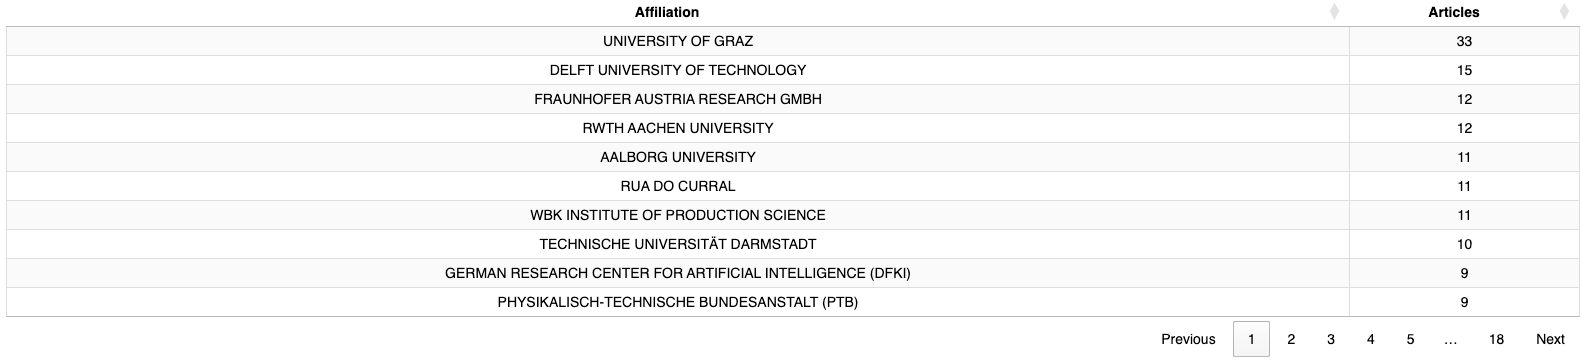
Most Relevant Affiliations
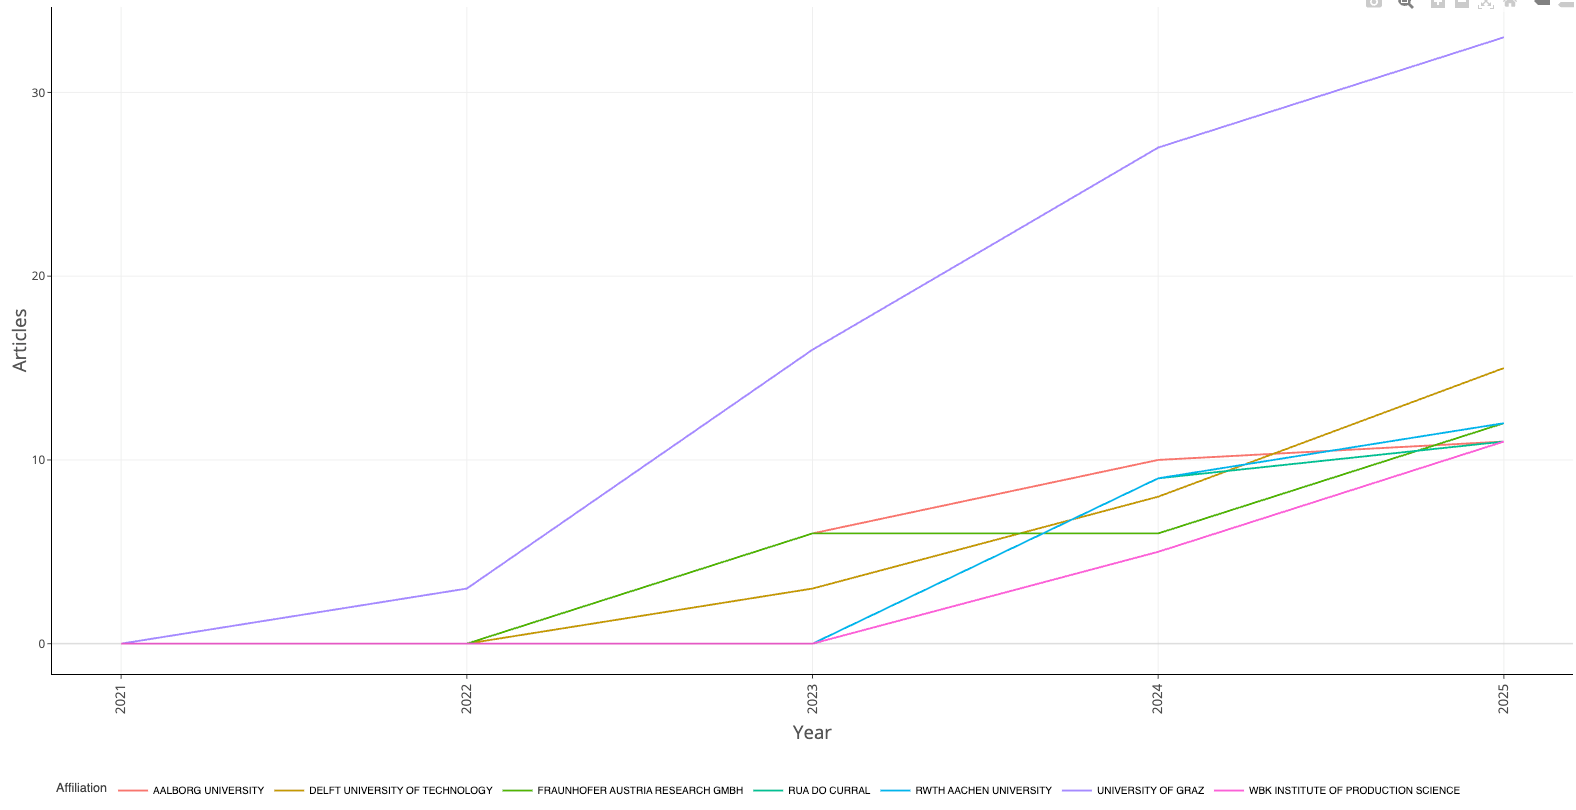
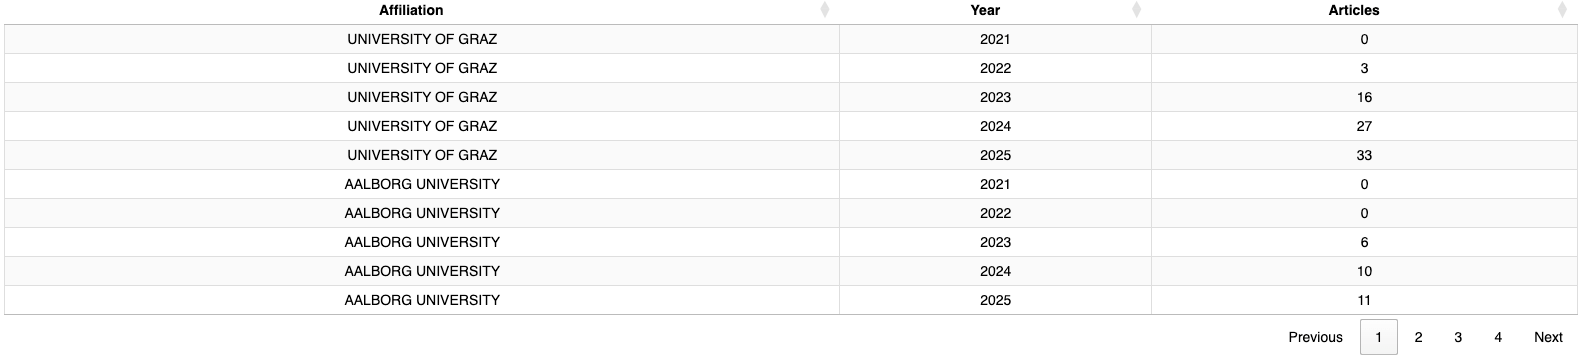
Affiliations’ Production over Time
Corresponding Author’s Countries
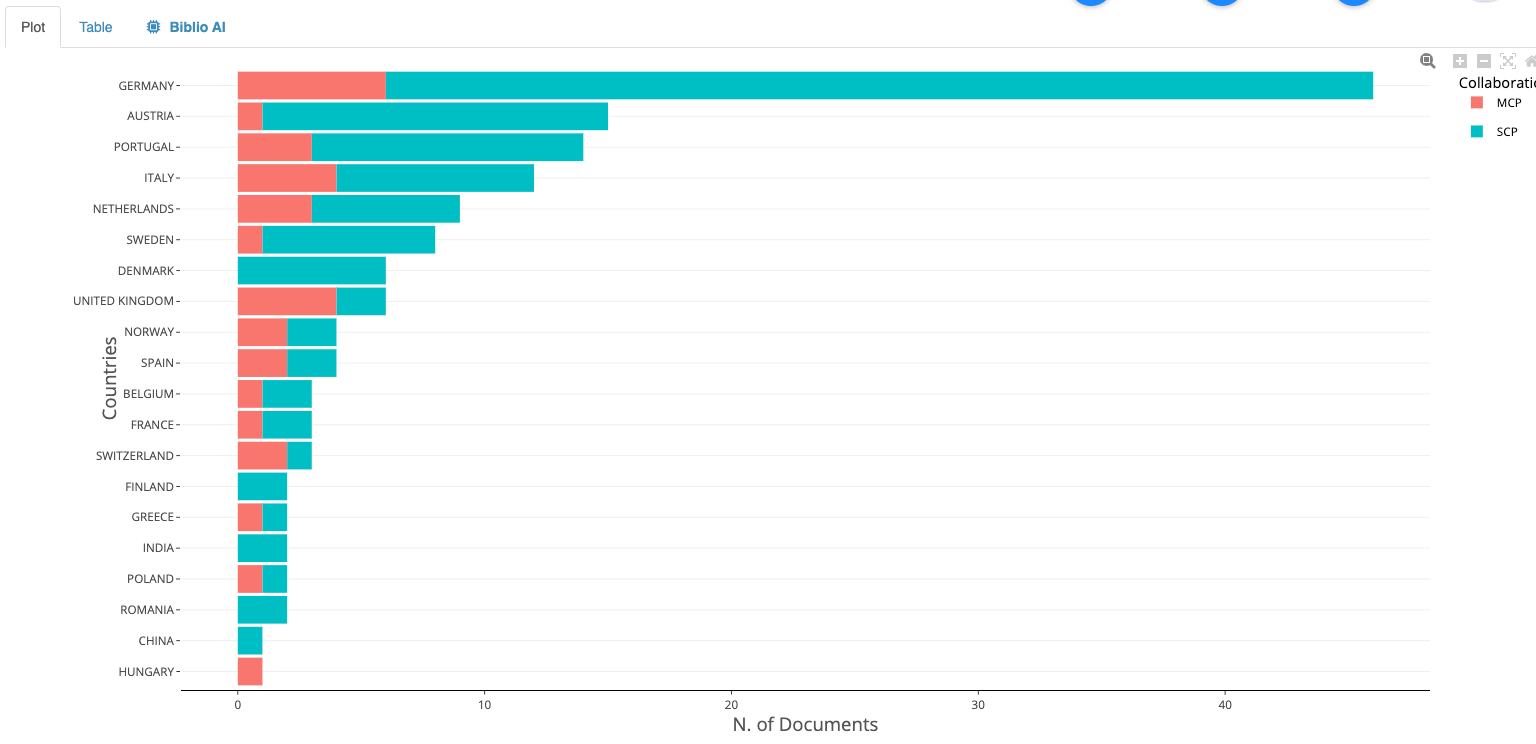
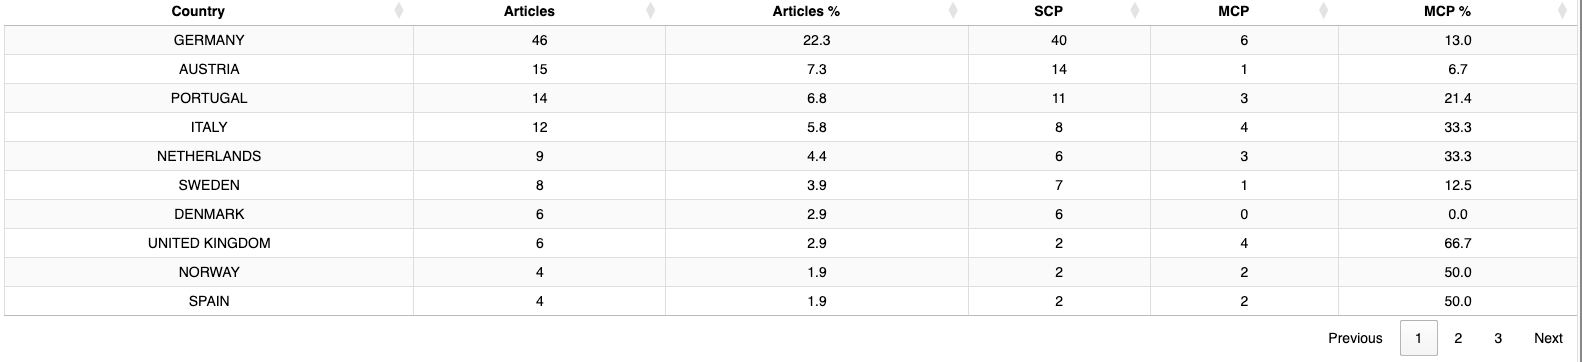
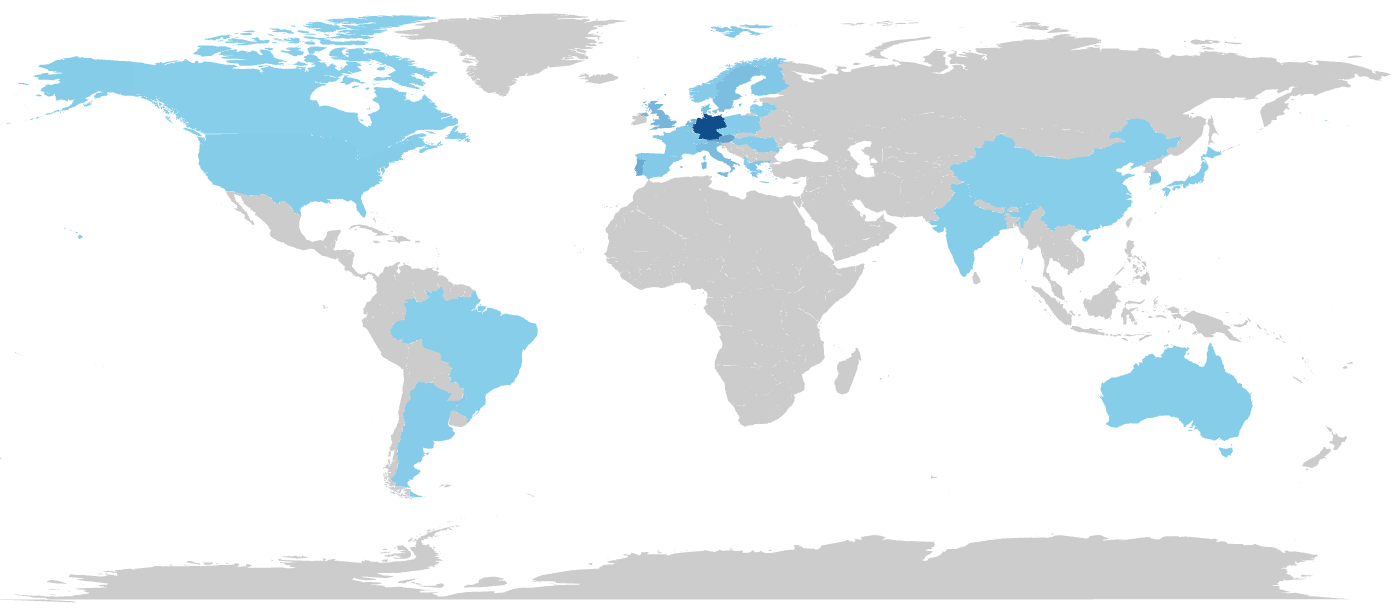
Okay, let’s break down this “Corresponding Author’s Country Collaboration Plot” generated from the SCOPUS database.
Overall Interpretation:
This plot visualizes the research output (articles) of different countries, based on the affiliation of the *corresponding author*. It distinguishes between publications where *all* authors are from the same country (SCP) and those with international collaborators (MCP). The MCP Ratio then gives a percentage view of the proportion of publications that are collaborative. This allows us to assess both research productivity and the degree of international engagement for each country.
Key Observations and Points for Discussion:
1. Most Productive Countries:
* Germany is the clear leader in terms of total publications (46 articles). This suggests a strong research base in the subject area covered by the Scopus collection being analyzed.
* Austria follows with 15 articles, showing a significant gap from Germany.
* Portugal is third with 14 articles, slightly below Austria.
2. International Collaboration (MCP):
* United Kingdom and Switzerland have the highest MCP percentage (66.7%). This signifies that a large proportion of their research output involves international teams, showing a focus on international collaboration. Though their overall article numbers are lower than others in the list, their collaborative efforts are high.
* Norway, Spain and Greece are at 50% for the MCP percentage, demonstrating that a significant part of their papers involve international collaborations.
* Italy and Netherlands shows similar MCP ratio (33.3%) and their total number of publications are also quite close to each other. This might imply similar research priorities and focus on international cooperation between these countries.
* Germany, despite being the most productive, has a relatively low MCP percentage (13%). This indicates that the majority of German research is conducted within the country, suggesting a strong domestic research infrastructure.
* Denmark, Finland, India, Romania, China, Japan, and Korea show 0% of collaborative publications. This might suggest a strong focus on domestic research. Alternatively, it *could* also indicate a barrier to international collaboration (e.g., funding limitations, language barriers, or research priorities). Or even an issue with author selection for corresponding author status. These findings need further exploration.
* Hungary and Lithuania have a MCP % of 100. However, the very low number of articles (1) make this an unstable estimation. It is impossible to conclude anything from this.
3. Balance Between Domestic and Global Research:
* Countries like Germany, Austria, Sweden, and Denmark have a clear emphasis on SCP. This could stem from strong domestic funding, well-established research institutions, or research agendas focused on national priorities.
* Countries with a higher MCP ratio, such as the United Kingdom and Switzerland, demonstrate a research strategy that prioritizes or benefits from international collaboration. This could be driven by access to diverse expertise, sharing of resources, or participation in global research initiatives.
4. Potential Considerations and Further Questions:
* Database Coverage: The results are based on SCOPUS data. It’s important to consider whether SCOPUS provides comprehensive coverage for all countries, or if there is a bias toward certain regions or publication types.
* Field Specificity: The interpretation here is general. The meaning of these results might be very different if the study is focused on a specific research area. It is crucial to consider if international collaboration is essential to the topic and if the research infrastructures of different countries are comparable.
* Funding Structures: National funding policies can greatly influence international collaboration. Countries with specific funding schemes for collaborative projects are likely to show higher MCP ratios.
* Corresponding Author Selection: The decision on who is the corresponding author can vary across disciplines and institutions. This could potentially skew the results if certain countries are more likely to designate international collaborators as corresponding authors.
* Sample Size and Statistical Significance: For countries with very few publications (e.g., 1 or 2), the MCP ratio can be easily skewed by a single collaborative paper. Care should be taken when interpreting these percentages.
How to Use This Interpretation in a Research Context:
- Comparative Analysis: Use the plot to compare research productivity and international collaboration levels across different countries.
- Identify Collaboration Opportunities: Identify countries with strong research output but lower MCP ratios as potential partners for future collaborations.
- Policy Implications: Examine whether national research policies are effectively promoting international collaboration and whether funding structures are aligned with desired levels of global engagement.
- Limitations: Acknowledge the limitations of using corresponding author data as a sole indicator of international collaboration. Consider supplementing the analysis with data on co-authorship networks and research grants.
In summary, this plot provides valuable insights into the research landscape of the countries being analyzed. By considering the interplay between research productivity, international collaboration, and potential influencing factors, researchers can gain a deeper understanding of the dynamics shaping global research.
Countries’ Scientific Production
Countries’ Production over Time
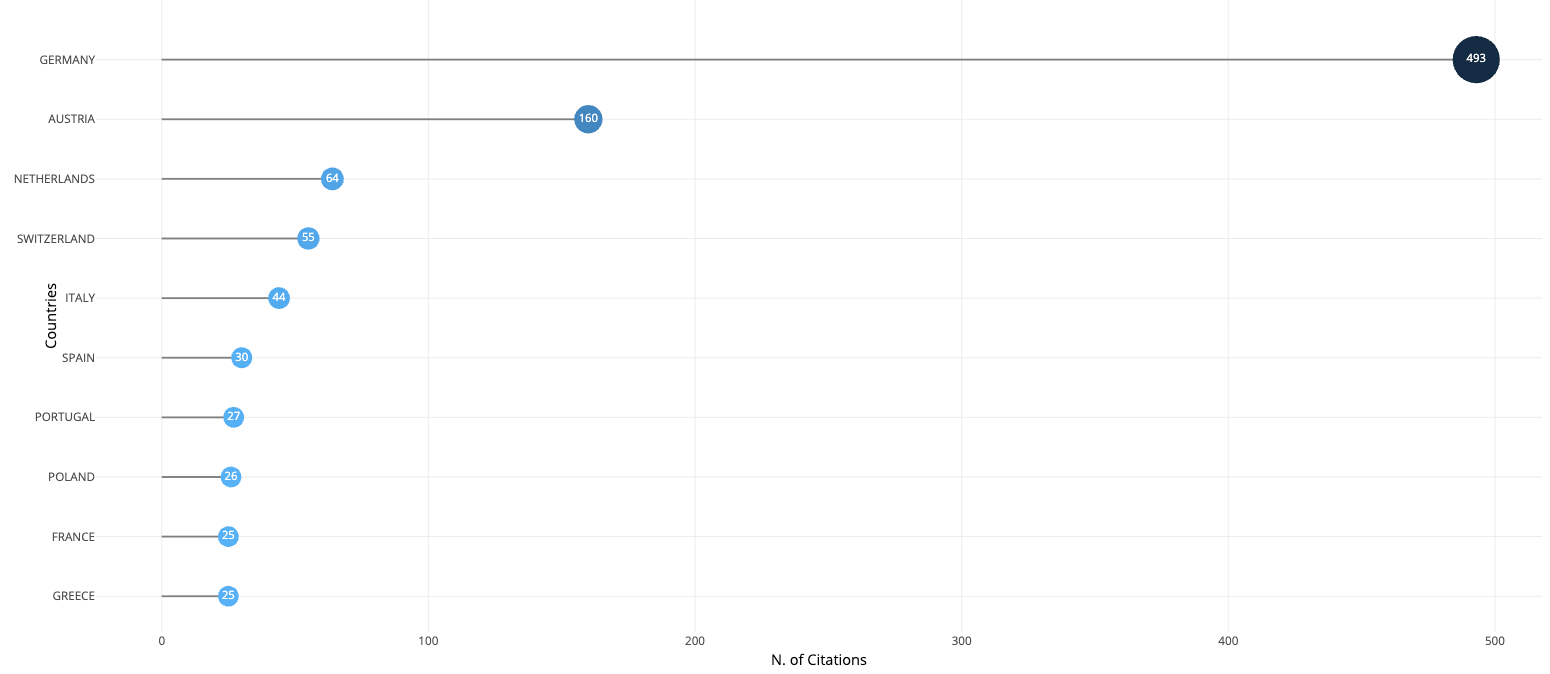
Most Cited Countries
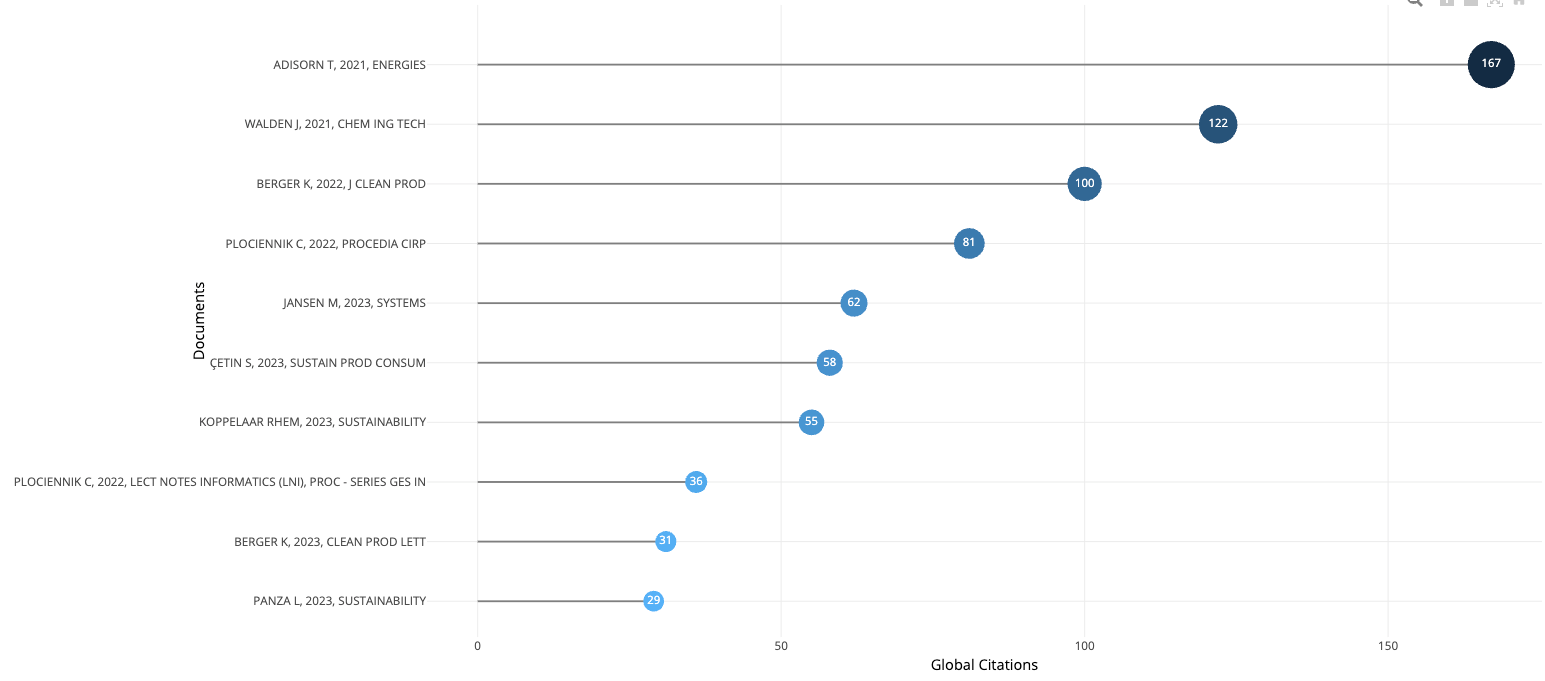
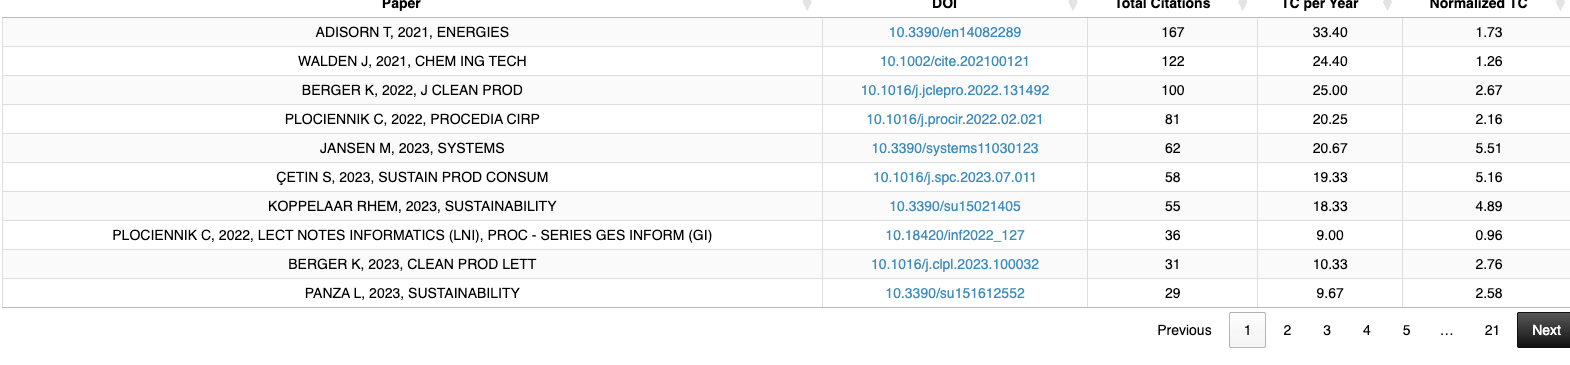
Most Global Cited Documents
Most Local Cited Documents
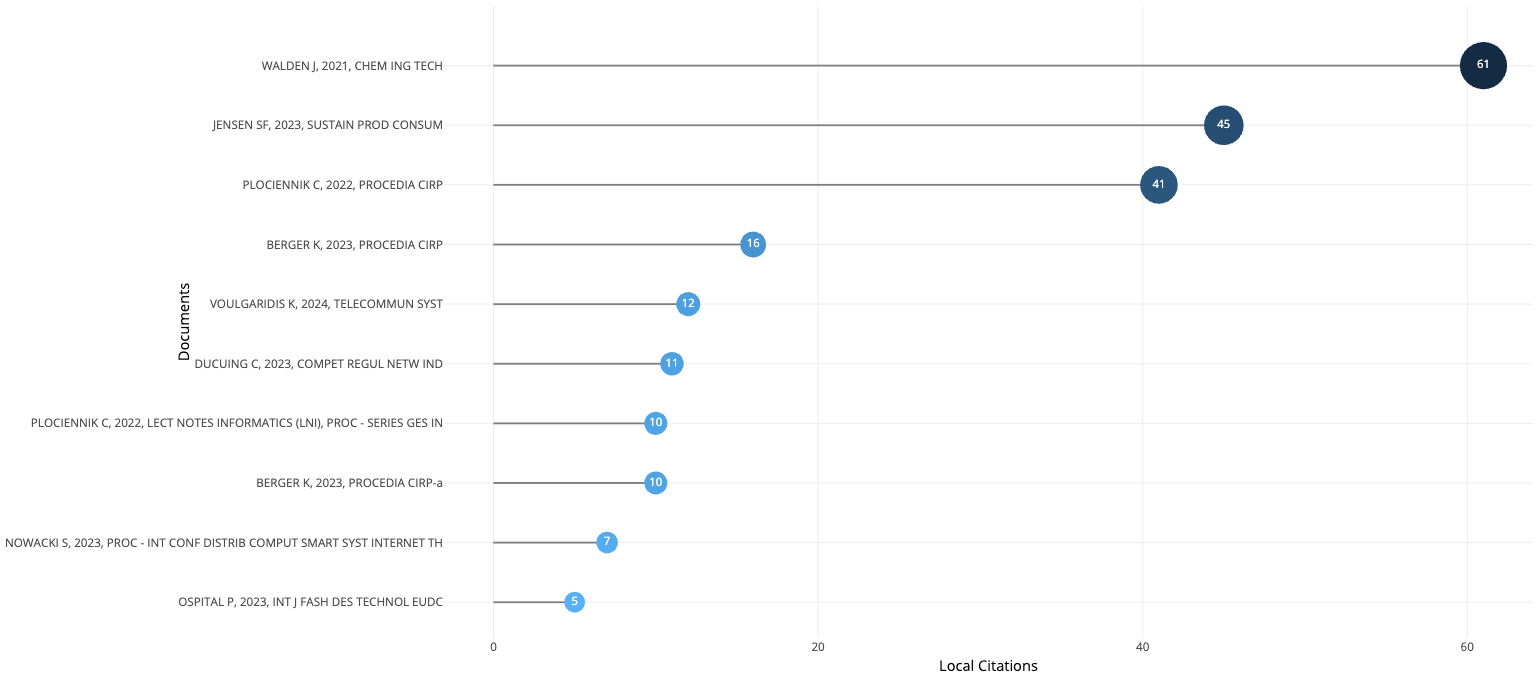
Okay, let’s analyze this list of most locally cited articles from your Scopus collection, keeping in mind the interplay between Local Citations (LC), Global Citations (GC), and their normalized counterparts (NLC and NGC). This will help us identify key publications within your research focus and their broader impact.
Overall Observations:
- Recent Publications Dominate: A significant number of the top locally cited articles are from 2023 and 2024. This is expected, as recent papers haven’t had as much time to accumulate global citations. However, high LC values for these recent publications indicate they are quickly gaining traction and relevance within the specific research area defined by your dataset. This also points to a possibly fast evolving field.
- Proceedings are Prevalent: *Procedia CIRP*, *Lecture Notes in Informatics (LNI)*, and various conference proceedings appear frequently. This suggests that the “local” research community (as defined by your dataset) heavily relies on conference publications and workshop proceedings.
- Discrepancies Between Local and Global Citations: There are stark differences between LC and GC for several articles. Some articles have high LC but zero (or very low) GC, suggesting they are highly relevant to the specific research community represented by this dataset but haven’t yet made a significant impact globally or are highly specific. Conversely, some articles have decent GC despite moderate or low LC, indicating a broader impact that isn’t necessarily reflected in the local context.
- Normalization Matters: The Normalized Total Citations (NLC and NGC) provide a much more nuanced picture. An article with a low raw citation count might have a high normalized value if it was published recently and is being cited more than average for its publication year.
Key Articles and Interpretations:
Let’s break down some of the most interesting entries:
- WALDEN J, 2021, CHEM ING TECH: LC 61, GC 122, NLC 3, NGC 1.26 – This article appears to have a good balance of local and global influence. The high LC suggests strong relevance to your research area, and the GC, while not extremely high, still shows decent global impact. The normalized values suggest that, relative to its publication year, it is cited more within the collection than outside. This suggests the research is relevant and has impact, the normalized citation values reflect that is has slightly more local impact than global impact.
- JENSEN SF, 2023, SUSTAIN PROD CONSUM: LC 45, GC 0, NLC 15.12, NGC 0 – This article is a standout case of strong local relevance. A very high LC, but no global citations, indicates a highly specialized piece of work that resonates strongly within the community defined by your dataset but has yet to gain wider recognition. The very high NLC reinforces this point: it’s being cited *far* more than average within your collection compared to other papers from 2023. Given the journal (*Sustainable Production and Consumption*), this could be a niche area within sustainability research that is well-represented in your dataset.
- PLOCIENNIK C, 2022, PROCEDIA CIRP: LC 41, GC 81, NLC 4.56, NGC 2.16 – Similar to WALDEN J, this article shows a good combination of local and global impact. The LC and GC are both significant, suggesting its relevance extends beyond the immediate research focus. The fact that it appears in *Procedia CIRP* (a conference proceedings) suggests that it may be focused on presenting novel methods and designs for novel technologies in the CIRP field.
- VOULGARIDIS K, 2024, TELECOMMUN SYST: LC 12, GC 25, NLC 28.62, NGC 13.36 – Even though the raw citation numbers are not the highest, the very high normalized values suggest that this very recent publication is making a splash. It has a decent number of local citations, but considering it was published in 2024, the rate at which it is being cited is significantly above the average for papers in that year.
- Articles with LC > 4 and GC = 0: *BERGER K, 2023, PROCEDIA CIRP*, *BERGER K, 2023, PROCEDIA CIRP-a*, *ZHANG A, 2024, INT J LOGIST RES APPLIC*, *VAN ENGELENBURG S, 2022, ACM INT CONF PROC SER*, *ALT S, 2023, CIRC ECON SUSTAIN*- These articles are interesting because they point to relevant research specific to the focus of the collection. The fact that are not globally cited suggest that there is specificity on the research areas, or that the publication is in local language (not indexed by SCOPUS)
Actionable Insights for Your Research:
1. Define “Local”: Carefully consider what the high prevalence of conference proceedings says about your research area. Is it a fast-moving field where conferences are the primary means of dissemination? Or does it reflect a focus on applied research that is more relevant to practitioners than to the broader academic community?
2. Explore Niche Topics: Investigate the topics covered in papers like JENSEN SF, 2023. The high LC and NLC, but zero GC, suggest a very specific research area strongly represented in your dataset. Understanding this niche could be valuable.
3. Track Emerging Trends: Pay close attention to the recent articles with high NLC and NGC, especially VOULGARIDIS K, 2024. These are likely indicators of emerging trends and hot topics in your field.
4. Consider Publication Bias: The dominance of certain journals and proceedings might reflect a publication bias within your “local” community. Be mindful of this when interpreting the results.
5. Evaluate Global Impact Strategy: If you aim to increase the global impact of your research, analyze the characteristics of papers that have both high LC and GC. What makes them appealing to a broader audience?
6. Identify potential research gaps: The topics covered in papers with high local citations but low global citations are pointing to research areas that may be underexplored by the global community.
By analyzing these citation patterns, you can gain a deeper understanding of the intellectual structure of your research field, identify key publications and trends, and strategically position your own research for maximum impact. Remember to always consider the limitations of bibliometric data and complement your analysis with qualitative assessments of the publications themselves.
Most Local Cited References
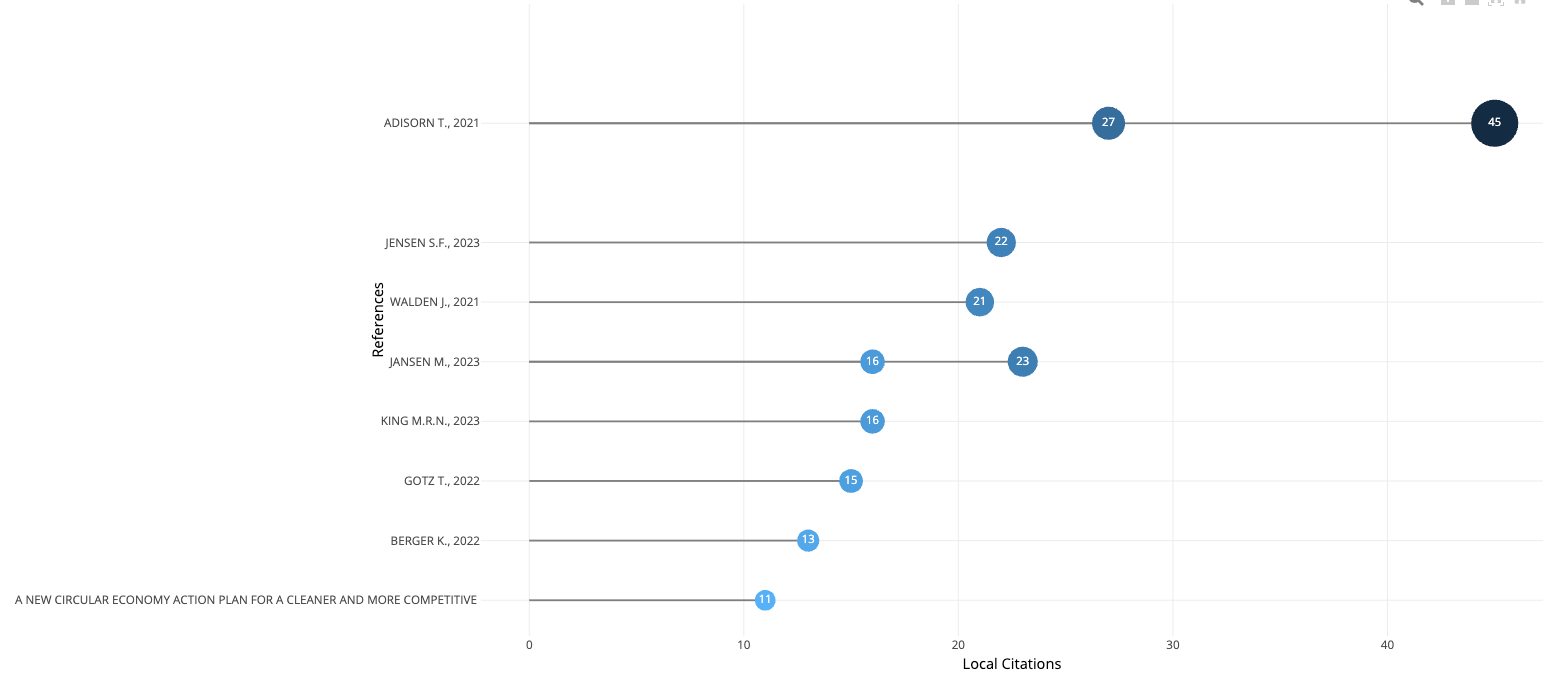
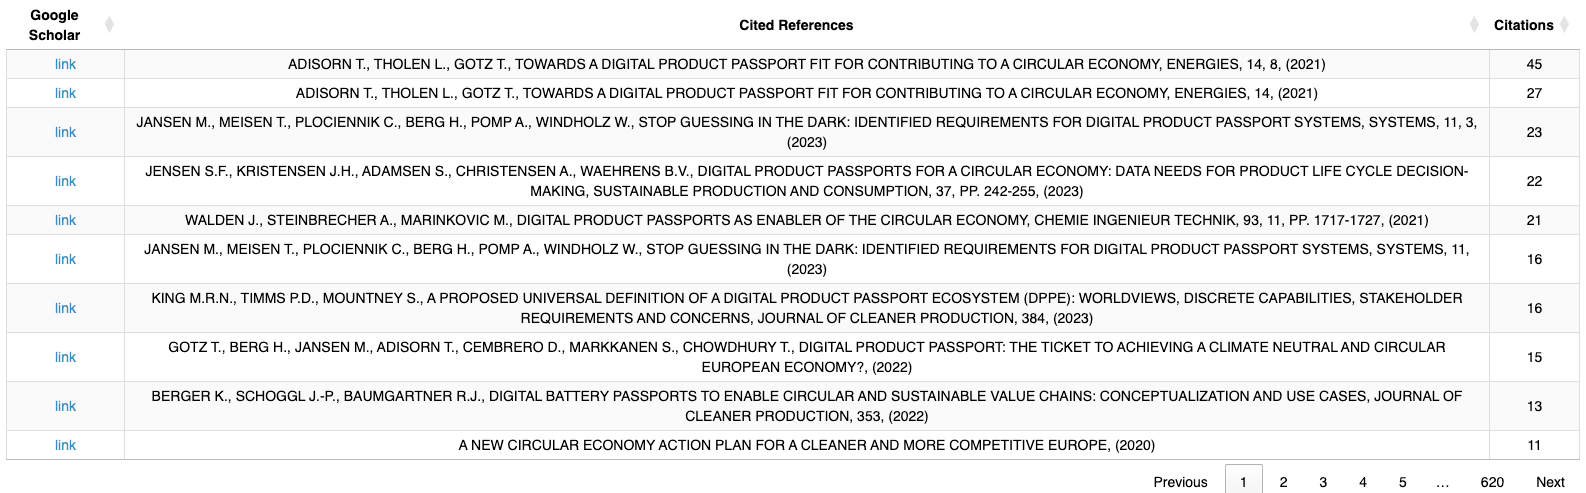
Reference Spectroscopy
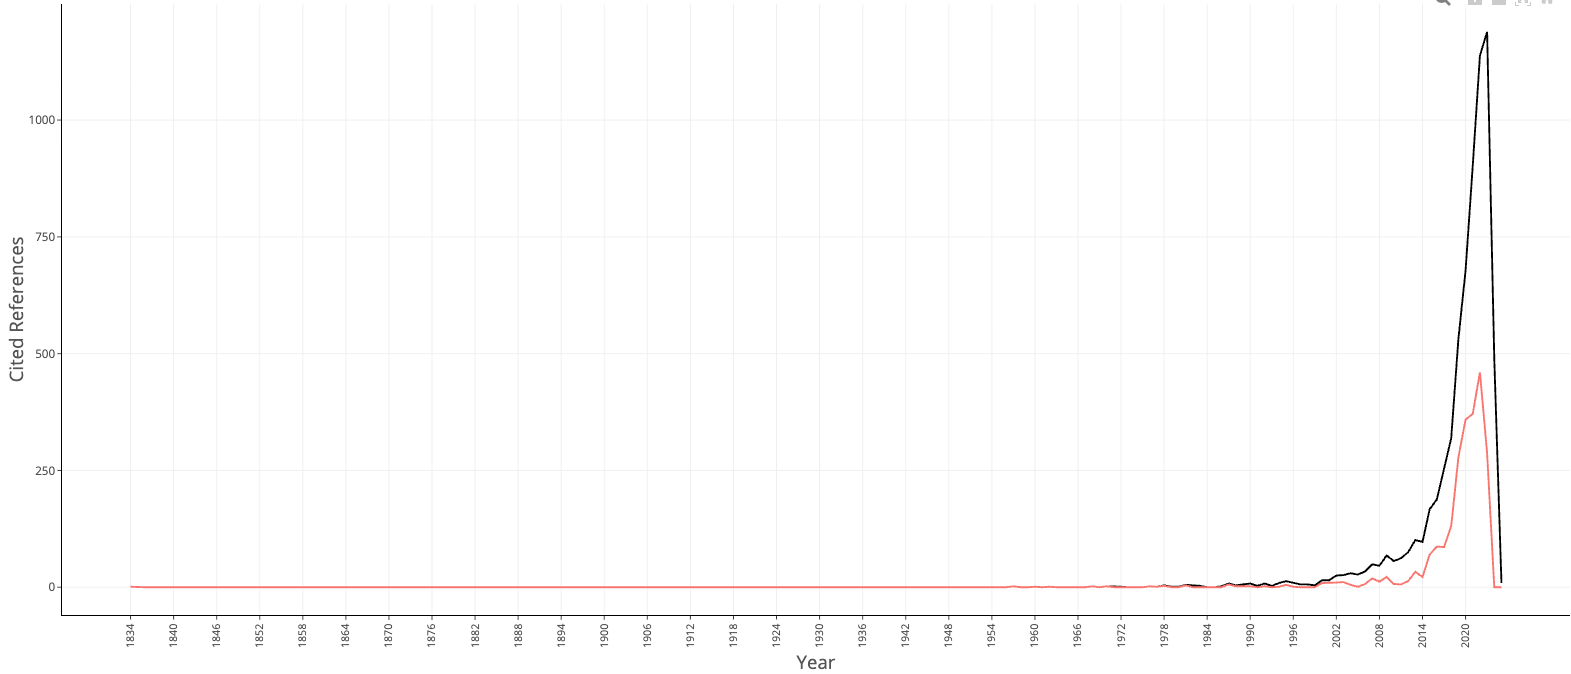
Okay, let’s break down this RPYS plot.
Overall Interpretation:
The RPYS plot reveals the historical roots and key turning points of the research field represented by your Scopus dataset. The black line, depicting the total number of cited references by publication year, illustrates the overall growth of research activity and knowledge accumulation in the field. The red line, highlighting deviations from the 5-year median, pinpoints specific years that contributed disproportionately influential publications, effectively identifying “hot” years in the field’s intellectual development. The fact that the black line is flat for so many years and then suddenly skyrockets suggests it is a relatively new, or rapidly growing field.
Key Observations and Discussion Points:
1. Early Influences (1978 & 1981): The early peaks in 1978 and 1981 signify seminal works that laid the foundation for the field. The presence of publications like Akerlof’s “The Market for ‘Lemons'” (1978), Charnes, Cooper, and Rhodes’s work on DEA (1978), and Williamson’s work on transaction cost economics (1981) suggests an early grounding in economics, operations research, and organizational theory, even if the dataset doesn’t seem to be exclusively about economics. The presence of Guba’s work on naturalistic inquiries (1981) suggests a consideration of alternative methodologies in qualitative inquiries. The spread across disciplines is a sign of multidisciplinarity in this field.
2. Mid-Period Developments (1987 & 1995): The 1987 and 1995 peaks indicate significant developments and shifts. The prominence of “Our Common Future” (the Brundtland Report) in 1987 and works by Donaldson and Preston on stakeholder theory (1995) and Graedel and Allenby on industrial ecology (1995) strongly suggests a focus on sustainability and environmental considerations within this field. Benbasat, Goldstein, and Mead (1987) and March and Smith (1995) suggest an influence of Information Systems. The diversity of themes suggests the field is undergoing a period of diversification.
3. Contemporary Trends (2003, 2007, 2009, 2013, 2016, 2022): The peaks from 2003 onwards represent contemporary trends and themes. The presence of work by Tranfield, Denyer, and Smart (2003) on evidence-informed management signals a growing emphasis on rigorous methodologies and systematic reviews. The peak in 2003 also suggests the field is becoming more diverse and mature, with a higher amount of references cited. References in 2007 focus on design science research methodologies (Peffers et al.) and theory building (Eisenhardt). From 2009 to 2022 there is an increasing focus on themes such as the circular economy, sustainability, and digital technologies like battery passports. Yin’s case study research (2009) suggests more methodological maturity. The fact that there are peaks in 2022 suggests this study is very recent.
4. Recent Explosion of Citations (post 2010’s): The very large increase in citations (black line) in recent years demonstrates that the field is developing very quickly, and may be entering the mainstream.
Questions to Consider & Further Investigation:
- Interdisciplinary Nature: The range of disciplines represented by these key publications suggests a highly interdisciplinary field. How do these different disciplines interact and contribute to the field’s unique perspective?
- Methodological Evolution: Has the field’s methodological approach shifted over time? Are there identifiable trends in the research methods employed?
- Practical Implications: The increasing focus on sustainability and the circular economy raises questions about the practical implications of this research. How is this knowledge being translated into real-world applications and policy changes?
- Database Bias: Consider the bias of the SCOPUS database. Are there important publications or areas of research that might be underrepresented due to the database’s coverage?
- Thematic Evolution: How have the core themes and research questions evolved over time? Are there any emerging themes or topics that are not yet fully reflected in the RPYS plot?
- Theoretical Foundations: What are the dominant theoretical frameworks used in this field? How have these frameworks influenced the direction of research?
- What kind of domain did the research cover? The dataset may cover a number of subjects, as is suggested in point 1, but it will likely cover one or two subjects in more detail.
In conclusion, this RPYS plot provides a valuable overview of the intellectual history of the field. By carefully examining the key publications and their temporal distribution, you can gain a deeper understanding of the field’s origins, evolution, and current trajectory. The list of highly cited articles in peak years is a great starting point for learning more about the area.
Remember to use this interpretation as a starting point for your own critical analysis. The insights gained from this plot should be contextualized with your own knowledge of the field and further investigation of the cited publications. Good luck!
Most Frequent Words
WordCloud

TreeMap
Words’ Frequency over Time
Trend Topics
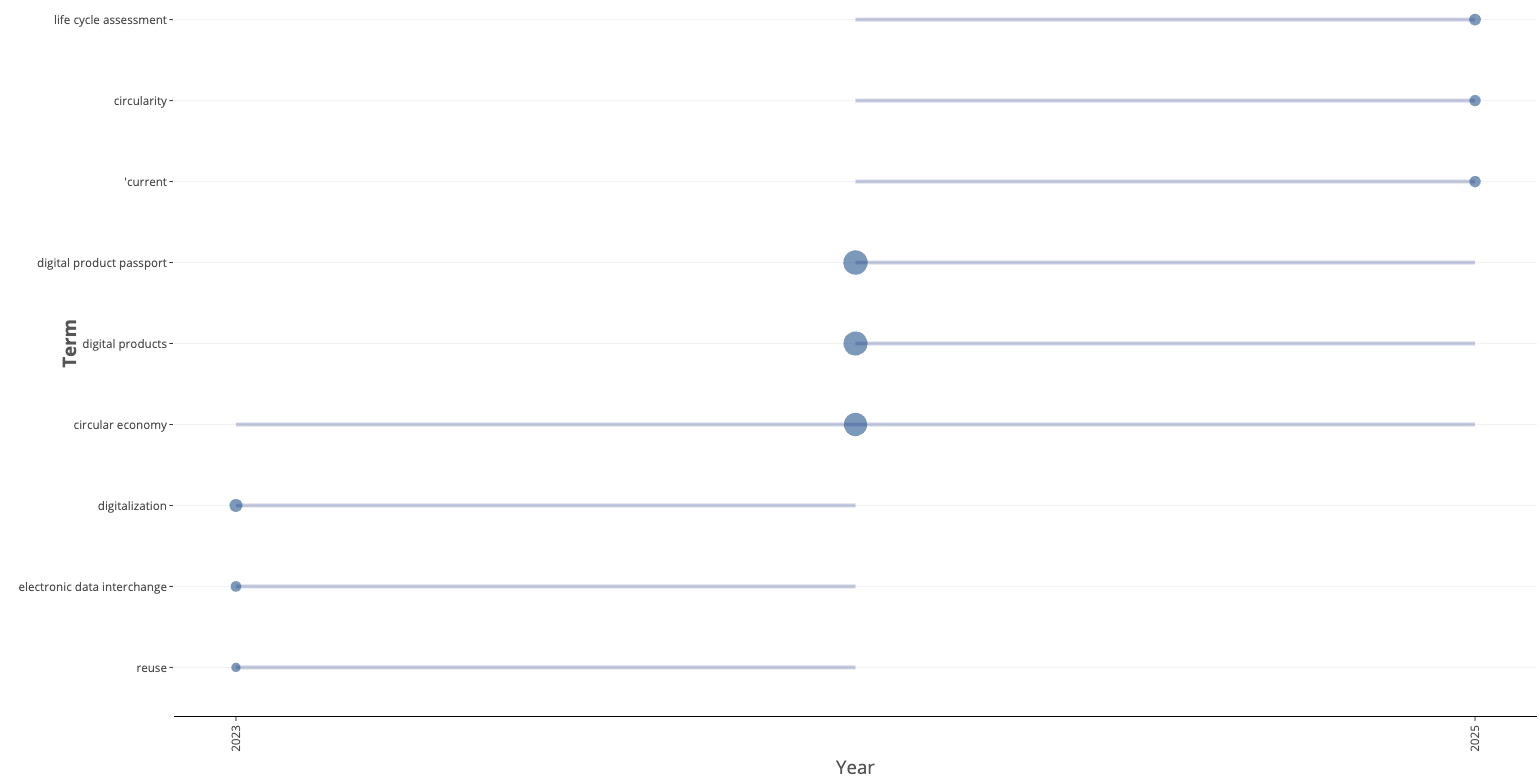
Okay, let’s break down the trend topics plot you’ve provided, drawing inferences and suggesting potential research directions.
Overall Interpretation:
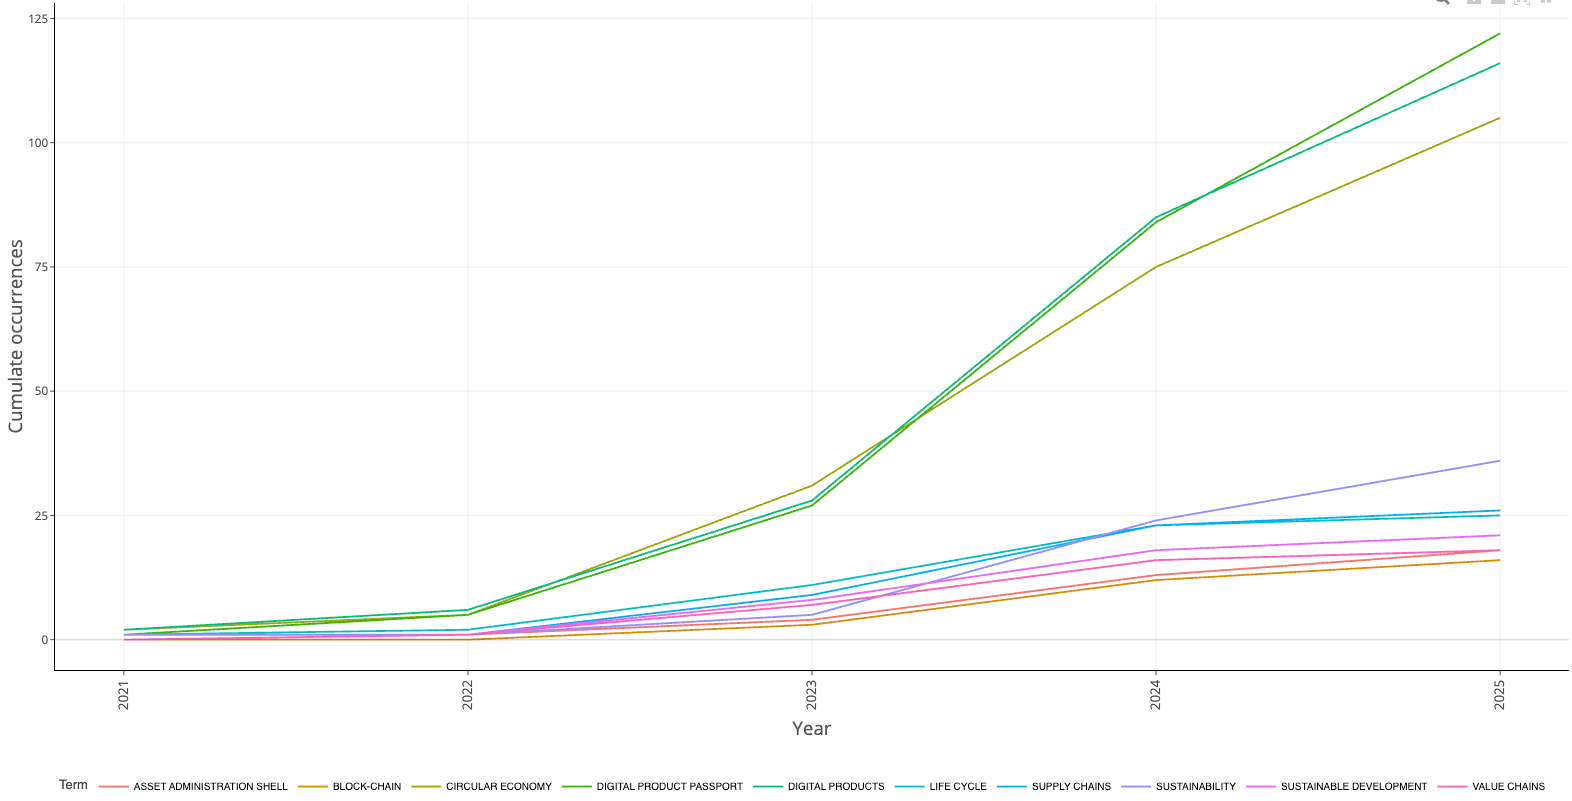
The plot visualizes the evolution of research keywords related to a specific field (likely related to technology and sustainability) from 2023 to 2025, based on the SCOPUS database. The analysis considered the top 3 words with the highest median frequency per year. The key takeaways are the persistence of some terms and the emergence/disappearance of others. The terms are extracted from the “KW_Merged” field, suggesting a combination or consolidation of keyword information during the data processing.
Specific Observations and Potential Interpretations:
- Established Trends (2023-2025 Persistence):
* “circularity,” “current,” “life cycle assessment”: The presence of these terms throughout the period suggests these are well-established and likely foundational concepts in the research domain. “Life cycle assessment” indicates a concern with the environmental impact of products and processes. The use of the word “current” as a keyword is unusual and could indicate research focusing on the state-of-the-art, up-to-date methodologies, or analysis of current events related to the field. Circularity highlights the importance of strategies to promote reuse, recycling and reduction of waste.
* Emerging/Declining Trends (2023 Appearance):
* “digitalization,” “circular economy,” “digital products,” “digital product passport”, “electronic data interchange”, “reuse”: The plot shows how these terms have emerged and have become trending topics in 2023. However, they don’t continue through 2025. Given this, we can infer that these keywords were probably trendy that year, although they were less relevant in the following years.
Further Investigative Questions:
Based on this initial interpretation, here are some questions to guide further investigation:
- Contextualize the Domain: What is the broader research domain represented in this SCOPUS collection? (e.g., sustainable manufacturing, information technology for circular economy, etc.) Understanding the general area will refine interpretations.
- Examine the “KW_Merged” Field: How are the keywords merged in the “KW_Merged” field? Are they author keywords, index keywords, or a combination? This impacts the type of trends you’re capturing.
- Explore the SCOPUS Query: What search query was used to retrieve this collection from SCOPUS? The query strongly influences the content and the trends observed.
- Investigate the Decline of Specific Keywords: Why did terms like “electronic data interchange” drop off? Did a new term emerge that encompassed that concept, or did the focus of research shift?
Limitations:
- Data Source Bias: The analysis is limited to SCOPUS. Results might differ with other databases (Web of Science, etc.).
- Keyword Selection: Using top 3 words per year can be arbitrary. There might be other significant keywords just outside the top 3.
- Keyword Inflation: The size of the bubbles representing the frequencies doesn’t provide a clear reference. Comparing with the total number of published documents by year will clarify if the frequency of the topics increased as an effect of the growth of the scientific literature in the specific domain.
- Time Horizon: The short time frame (2023-2025) limits the ability to identify long-term trends.
By addressing these questions and acknowledging the limitations, you can develop a more nuanced and insightful interpretation of the trend topics plot, leading to more robust research conclusions. Good luck!
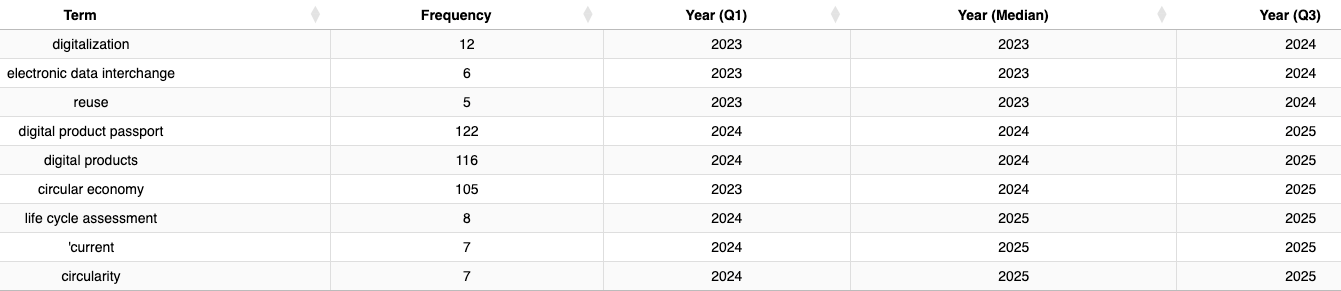
Okay, let’s break down this trend topics plot. This visualization displays how the prominence of specific keywords related to the `KW_Merged` field has evolved from 2023 to 2025 within the SCOPUS dataset. It highlights terms with the highest median frequency in each year. Here’s a structured interpretation:
Overall Observations:
* Temporal Range: The analysis covers a relatively short timeframe (2023-2025). This suggests we’re looking at relatively recent trends.
* Theme Focus: Based on the keywords, the research seems to be heavily focused on:
* Sustainability and Circular Economy: Terms like “sustainability,” “circular economy,” “life cycle assessment,” “life cycle,” and “reuse” dominate. This strongly indicates a significant research interest in these areas.
* Digital Transformation and Technology: The presence of “digital technologies,” “digital products,” “digital product passport,” “digitalization”, “electronic data interchange” and “battery passport” suggests a second major area of interest revolves around the intersection of technology and sustainability, particularly in product lifecycles and supply chains.
* Supply Chain and Stakeholder Considerations: “Supply chains” and “stakeholder” suggest researchers are considering the broader ecosystem impacts of products and processes.
* Decision Making: The presence of “decision making” suggests a research focus on strategies and frameworks that enable businesses, governments or others to improve outcomes.
Specific Term Trends:
- Emerging vs. Established Topics: We can infer which topics are gaining momentum and which are more established.
- Term Frequency Bubbles: The size of the bubbles allows direct visual comparison of the frequency of each term in different years. Larger bubbles suggest a higher frequency and thus greater prominence.
- Interquartile Range (IQR) Lines: The light blue lines, representing the IQR, give an indication of the spread or variability of the term’s frequency across the publications in each year. A wider IQR suggests a broader range of usage within the literature, potentially indicating different contexts or interpretations of the term. A narrow IQR suggests more consistent usage.
- 2023 Dominance: Many of the terms appear to have significant frequency in 2023, as indicated by the initial point on the IQR line.
- Growth of “digital product passport” “digital products” “circular economy” “sustainability” “supply chains” “life cycle”: It appears that the frequency of these terms grew from 2023 to 2025.
- Growth of “life cycle assessment” “decision making” “current” “digital technologies” “stakeholder” “battery passport”: It appears that the frequency of these terms grew from 2023 to 2025.
- Decline of “reuse” “electronic data interchange” “digitalization”: It appears that the frequency of these terms declined from 2023 to 2025.
Critical Discussion Points & Further Investigation:
- Database Bias: The analysis is based on SCOPUS data. SCOPUS has strengths and weaknesses in terms of coverage. Consider if the trends observed are specific to the SCOPUS coverage or if they would be consistent across other databases (e.g., Web of Science).
- Keyword Selection: The `KW_Merged` field was used. How are these keywords created/assigned? Are they author-supplied, database-assigned, or a combination? The method of keyword assignment can influence the results.
- Contextual Analysis: While this plot shows *what* terms are trending, it doesn’t explain *why*. To understand the context, you would need to examine the actual publications associated with these keywords. What specific aspects of sustainability, digital technologies, or supply chains are being discussed?
- Limitations of Median Frequency: The median frequency is a robust measure, but it might obscure more nuanced trends. Are there specific *types* of publications (e.g., reviews, empirical studies, theoretical papers) that are driving these trends? A more granular analysis could be useful.
- Geographical distribution: Is the observed trend geographically concentrated or distributed across different countries?
In summary: This trend topics plot provides a valuable overview of research interests within the SCOPUS dataset. The prominence of keywords related to sustainability, digital technologies, supply chains, and related concepts suggests a vibrant and evolving research landscape. Further investigation of the underlying publications is needed to gain a deeper understanding of the specific research questions, methodologies, and findings associated with these trending topics.
Do you want me to elaborate on any of these points or conduct further analysis based on this initial interpretation?
Clustering by Coupling
Co-occurrence Network
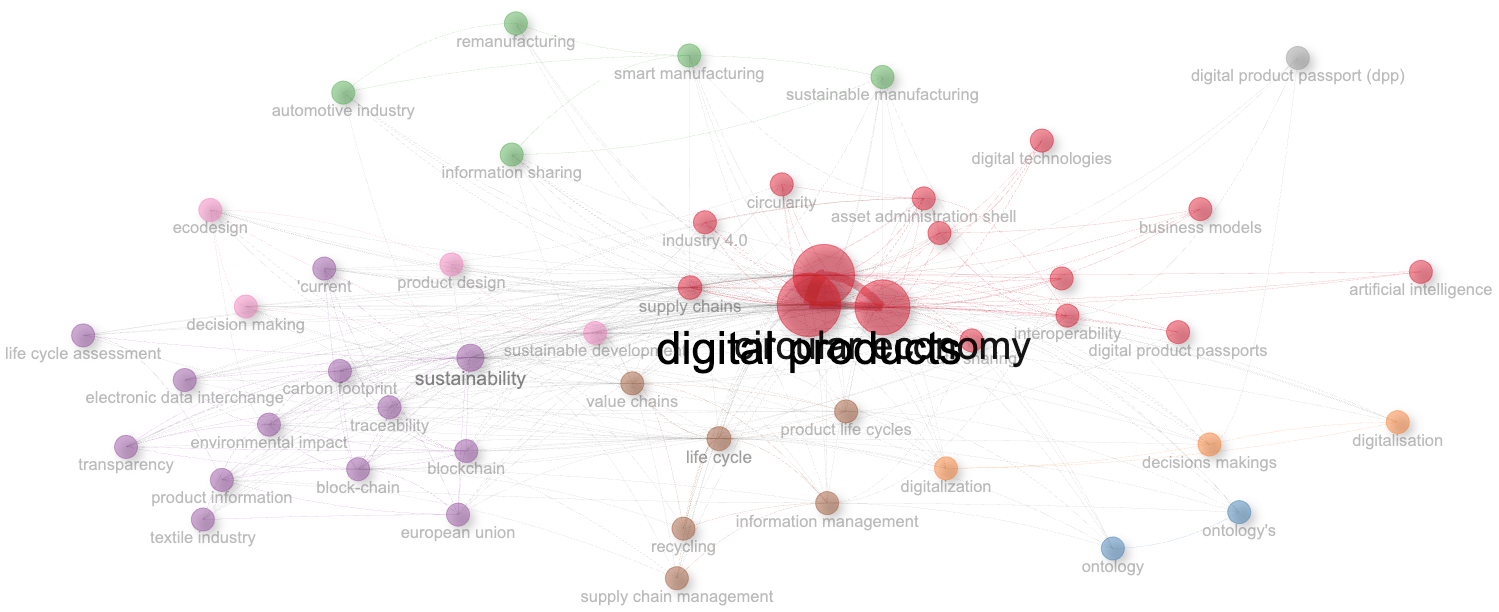
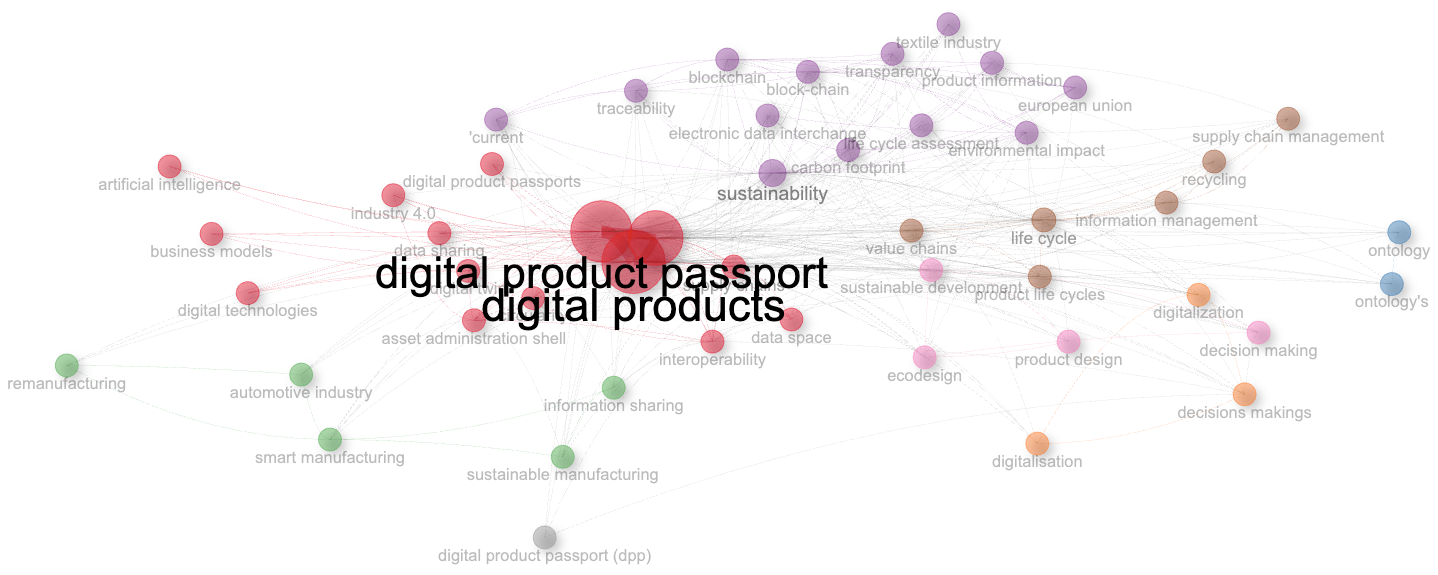
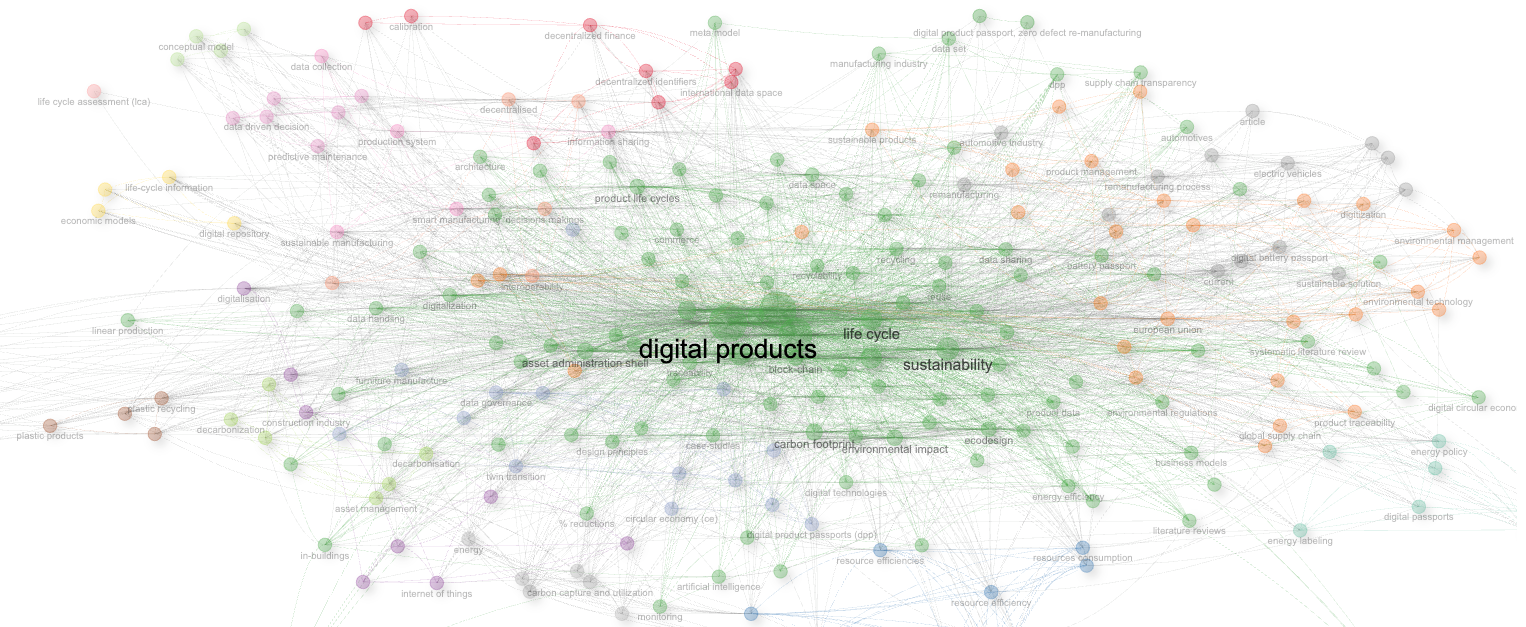
Okay, let’s analyze this word co-occurrence network of keywords extracted from your SCOPUS dataset. Based on the parameters and the visual representation, here’s a breakdown of its structure and key themes:
Overall Structure & Parameters
- Data Source: SCOPUS – Indicates a broad coverage of scientific literature.
- Normalization: “Association” – This is a crucial point. Association strength implies a relationship between terms, adjusted by the number of times each term occurs independently. It tends to highlight relationships between less frequent terms which can be insightful, but it’s different from simple co-occurrence frequency.
- Network Type: “Auto” – Likely means the algorithm automatically determined the most appropriate network layout based on the data, typically optimizing for clarity and community detection.
- Clustering: “Walktrap” – This is a community detection algorithm. Walktrap identifies communities by simulating random walks on the network. The intuition is that random walkers will tend to stay within dense communities for longer periods.
- Visual Parameters: Label size, halo, curved edges, edge size, alpha (transparency), node size – these are all visual tweaks to optimize readability. The larger node size indicates a higher degree of connectivity (more connections to other keywords).
- Filtering: `remove.isolates = TRUE` is important because it removes terms that are only used in one or two publications, which would provide little insights. `remove.multiple = FALSE` ensures that the weights of multiple connections are kept, which will lead to a more faithful representation of the relationships between keywords.
Community (Topic) Identification
The network clearly shows several distinct communities, indicated by different colors, reflecting different research themes. Here’s a breakdown of possible themes based on the clustered keywords:
- Red Cluster (Central): The largest cluster, centered around “digital products” and “product data.” This appears to be the core theme of the dataset. Other important terms within this cluster are “industry 4.0”, “asset administration shell”,”digital product passports”,”interoperability”,”data sharing”,”digital technologies” and “circularity”. These terms suggest a focus on the digital aspects of product management, data governance, and related technology enablers.
- Purple Cluster (Sustainability and Product Lifecycle): This cluster includes “sustainability,” “carbon footprint,” “traceability,” “blockchain,” “environmental impact,” “life cycle assessment,” “european union” and “textile industry”. This community focuses on sustainability and environmental considerations in the context of products. The presence of “blockchain” suggests an interest in using this technology for supply chain transparency and traceability.
- Green Cluster (Manufacturing and Supply Chain): This cluster is composed by “automotive industry”, “remanufacturing”, “smart manufacturing”, “sustainable manufacturing” and “information sharing”. It points to research on manufacturing processes, particularly related to sustainability, Industry 4.0 practices, and information exchange.
- Brown Cluster (Life Cycle and Information Management): “life cycle”, “product life cycles”, “information management”, “recycling” and “supply chain management” are related to the product life cycle, from information management to recycling and supply chain optimization.
- Orange Cluster (Digitalization and Decision-Making): This cluster is smaller, containing “digitalization,” “decision makings”, and “ontology”. This points towards the use of ontologies and decision-making processes in the digitalization of product-related information.
- Blue Cluster (Ontology): With the presence of “ontology’s” and “ontology”, this cluster revolves around the utilization of ontology for products.
- Grey Cluster (Digital Product Passport): The presence of “digital product passport (dpp)” as an isolated node suggests that while relevant, research on this specific term might be somewhat distinct or emerging within the broader dataset, perhaps not yet strongly integrated with other established themes.
Relevance of the Most Connected Terms
The size of the nodes visually represents the degree of each keyword (number of connections). The central node, “digital products”, “product data”, “digital productomy” (assuming this refers to the representation/model of a digital product) are obviously of high importance.
- A critical point is to consider the *nature* of the relationships. Since “association” was used for normalization, the links are not simply reflecting frequency of co-occurrence. They reflect a statistically significant association *beyond* what you’d expect given the individual frequencies of those terms.
- The highly connected terms act as bridges connecting the different communities. For example, “sustainability” links the product-focused cluster with the environmental impact and lifecycle considerations.
Interpretation and Discussion Points for Your Research
Based on this analysis, here are some potential discussion points for your research:
1. Confirmation of Research Focus: The centrality of “digital products” and “product data” confirms that your research area is well-represented in the literature captured by your SCOPUS search.
2. Interdisciplinary Nature: The network highlights the interdisciplinary nature of the field. Research on digital products intersects with sustainability, manufacturing, information management, and emerging technologies like blockchain and ontologies.
3. Emerging Trends: The presence and connection strength of terms like “digital product passports” indicate emerging trends in the field. Discuss the potential implications of DPPs for traceability, circular economy, and regulatory compliance.
4. Community Gaps: Are there any communities that *should* be more strongly connected? For instance, is the link between the “manufacturing” cluster and the “sustainability” cluster as strong as it should be? If not, this might suggest an area where more research is needed to integrate sustainability considerations directly into manufacturing processes.
5. Methodological Considerations: Acknowledge the limitations of your bibliometric analysis. Keyword analysis is inherently limited by the choice of keywords used by authors. Also, emphasize the importance of the “association” normalization when interpreting the relationships between terms. It highlights statistically significant relationships, not just simple co-occurrence.
Further Research Directions
- Temporal Analysis: If your dataset includes publication dates, consider performing a temporal analysis to see how these communities have evolved over time. Are some clusters becoming more prominent while others are fading?
- Author/Journal Analysis: Explore the authors and journals most associated with each cluster. This can help you identify key researchers and publications in specific sub-areas.
- Content Analysis: Supplement this bibliometric analysis with a qualitative content analysis of the most relevant papers to gain a deeper understanding of the research questions, methodologies, and findings within each community.
By carefully considering the structure, communities, and key terms in this word co-occurrence network, you can gain valuable insights into the research landscape and identify opportunities for your own work. Remember to always critically evaluate the results and consider the limitations of the bibliometric approach.
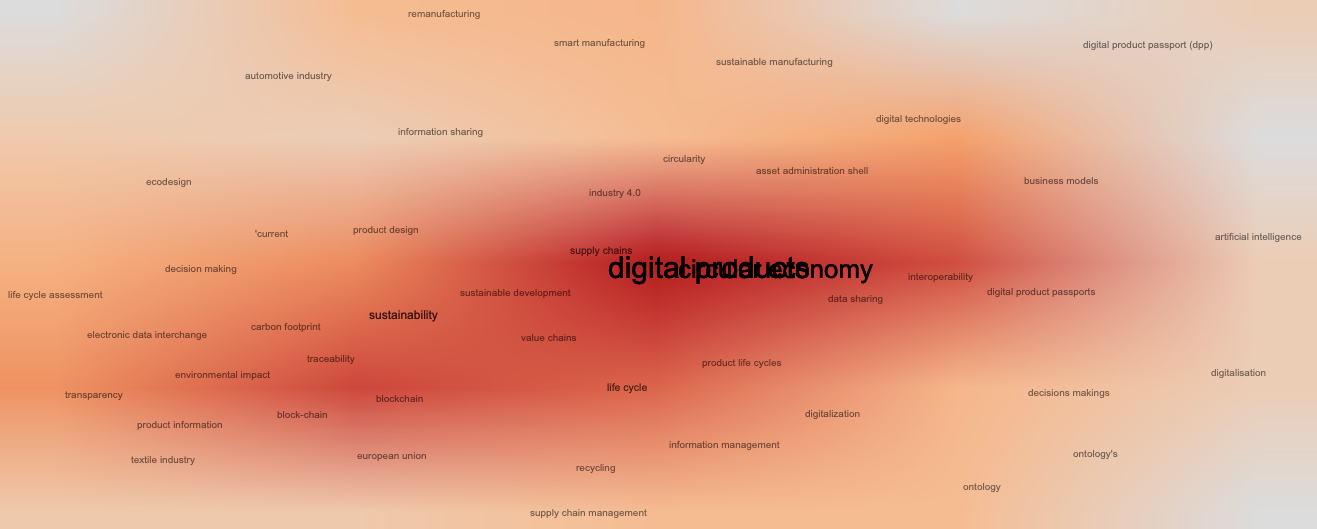
Thematic Map
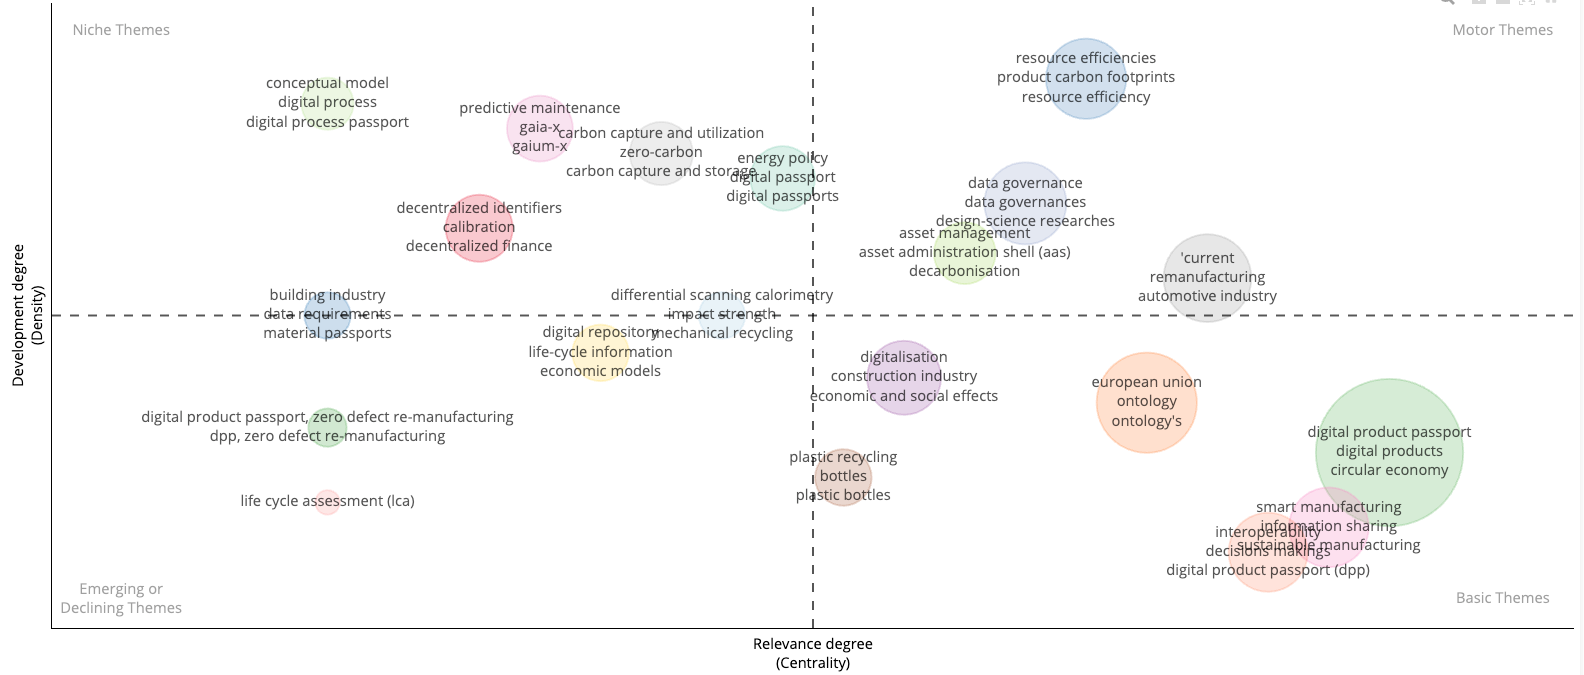
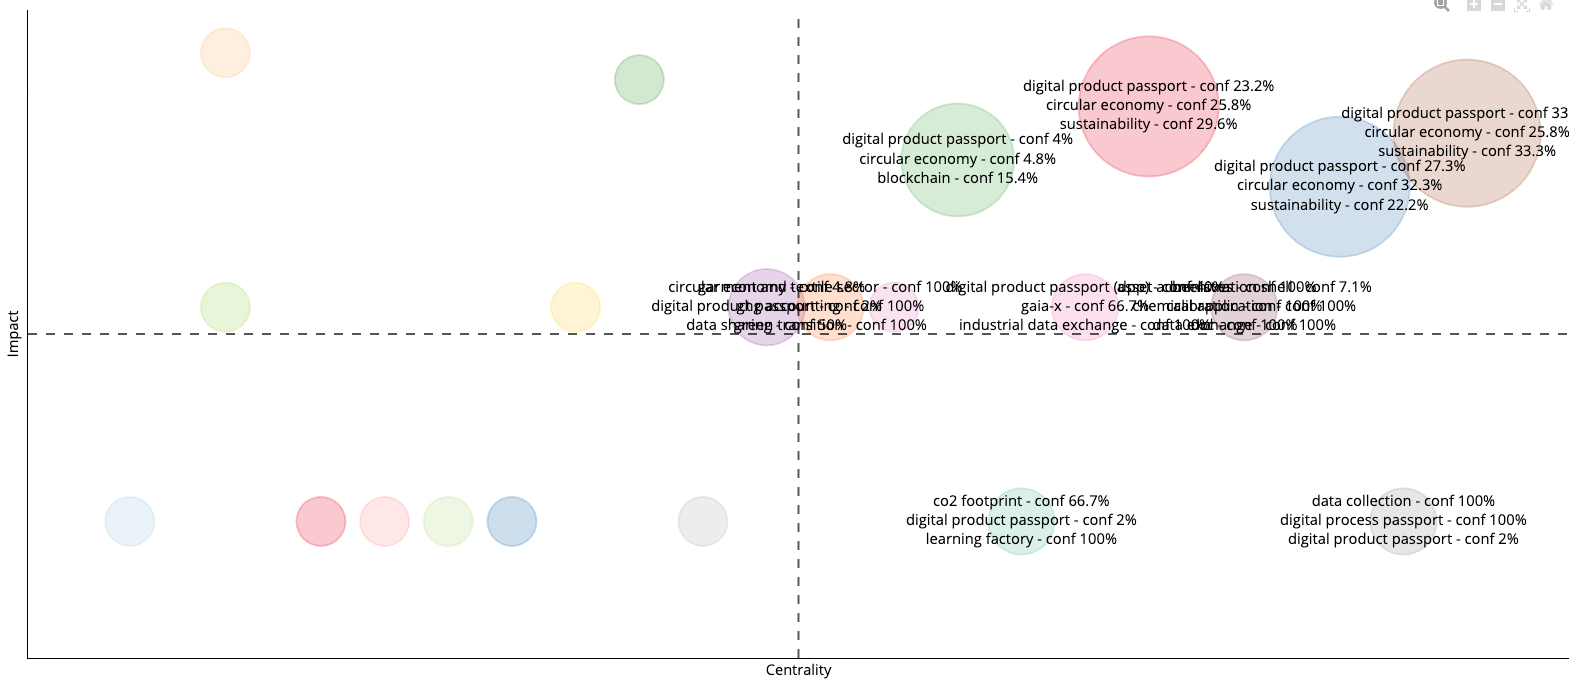
Okay, let’s break down this strategic map derived from your bibliometric analysis of SCOPUS data.
Overall Structure and Parameters:
* Strategic Diagram: The map is a two-dimensional representation.
* The x-axis (horizontal) represents *Centrality* (Relevance Degree). This indicates how important a topic is within the network of publications. Higher centrality suggests the topic is more interconnected and influential.
* The y-axis (vertical) represents *Density* (Development Degree). This indicates how well-developed or researched a topic is. Higher density suggests more publications and focused research on that topic.
* Quadrants: The intersection of the centrality and density lines divides the map into four quadrants, each with distinct characteristics.
* Motor Themes (Upper Right): High centrality and high density. These are well-developed and highly influential areas of research.
* Basic Themes (Lower Right): High centrality but low density. Fundamental topics that are important but may be under-researched or have potential for further development.
* Niche Themes (Upper Left): Low centrality and high density. Specialized or emerging areas that are well-developed but not yet widely influential.
* Emerging/Declining Themes (Lower Left): Low centrality and low density. Areas that are either newly emerging or losing prominence in the research landscape.
* Data Source and Parameters:
* Database: SCOPUS
* Field: KW\_Merged (This means the analysis is based on the merged keywords from the publications, providing a topical view).
* n = 250: The analysis likely considered the top 250 keywords based on their frequency.
* minfreq = 2: Keywords appearing less than twice were excluded.
* ngrams = 1: Analysis focuses on single-word keywords (unigrams).
* stemming = FALSE: Keywords were not stemmed (reduced to their root form).
* size = 0.3: This parameter likely influences the visual size of the cluster bubbles.
* n.labels = 3: Each cluster is represented by its three most central articles.
* community.repulsion = 0; repel = FALSE: These parameters influence how the clusters are positioned relative to each other, likely minimizing overlap.
* cluster = walktrap: The “walktrap” algorithm was used for community detection, identifying clusters of related keywords.
Cluster Interpretations:
Let’s analyze some of the key clusters based on the information you provided:
- Digital Product Passport (DPP): Located in the “Basic Theme” quadrant, this cluster is highly central. The most central articles (Psarommatis F, Haupt J, Pehlken A, all 2024) are recent and focus on DPP, with some related to zero-defect re-manufacturing. This suggests DPP is a core concept gaining significant traction, but its theoretical underpinnings or practical implementations might still be developing. The presence of “circular economy” within the cluster reinforces this interpretation.
- Data Governance: Positioned towards the “Motor Theme” quadrant, indicating both high centrality and density. The prominent articles (Reich RH, Boukhatmi Ä, Steinwender A) are also recent (2023-2024). This signifies that data governance is not only important but also a well-researched and active area, likely driven by increasing concerns about data quality, security, and compliance in various industries.
- Resource Efficiencies: Located in the “Motor Theme” quadrant. Articles by GROß HJ (2024) appear prominently. This indicates that resource efficiency is a core, well-established area of research.
- European Union: A relatively central theme with an average density. GIEß A (2025), KASIMATIS CN (2024), and BERGER K (2023) are the most central articles. This suggest a focus on policy and regulatory aspects in the context of the EU.
- Carbon Capture and Utilization (CCU): Positioned in the “Niche Theme” quadrant, it suggests a specialized area with high density but lower overall influence (at least in the dataset analyzed). The prominent articles (Schnicke F, Deepshikha, both 2025) being recent indicates that it’s a current niche.
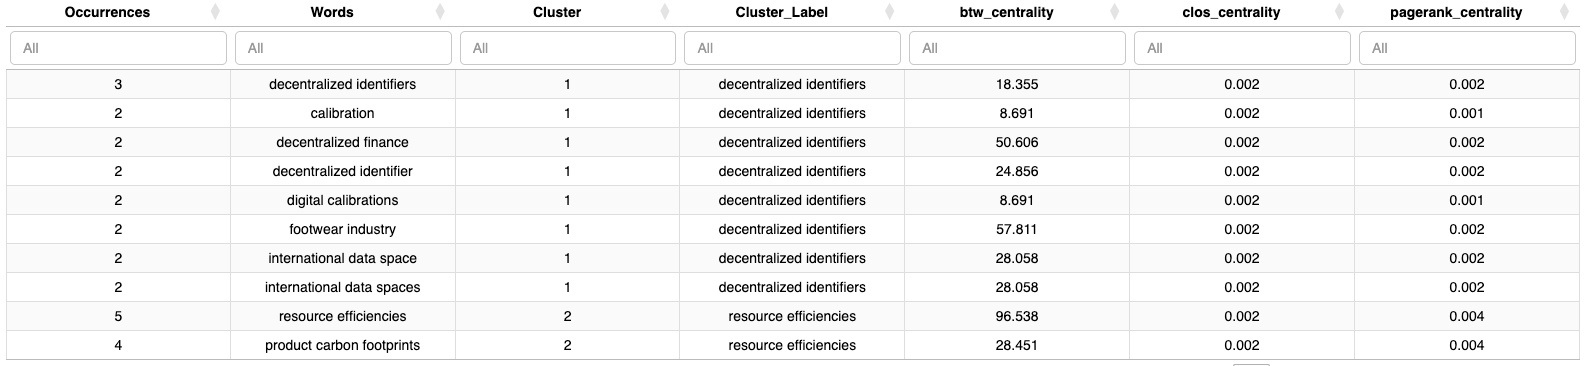
- Decentralized Identifiers: Located in the “Niche Theme” quadrant, suggesting an area that is well-developed but not yet widely influential. The prominent articles (Sousa C, Sołtysiński T, Hulea M) focus on the technical and applied aspects.
- Building Industry: Located in the “Niche Theme” quadrant, suggesting a specialized area with high density but lower overall influence. The prominent articles (ÇETIN S, 2023) indicates that it’s a current niche.
- ‘Current’ (cluster name): Centrality seems very high for all publications. Further examination of the content of these articles may be needed.
Actionable Insights and Recommendations:
1. DPP (Digital Product Passport): Given its position as a “Basic Theme,” investigate the practical implementations, challenges, and scalability of DPP. Explore case studies and empirical research to solidify the theoretical foundations.
2. Data Governance: Monitor the evolving landscape of data governance, focusing on new frameworks, technologies, and best practices. Investigate the intersection of data governance with related areas like AI, IoT, and blockchain.
3. CCU (Carbon Capture and Utilization): Explore the potential for broader adoption of CCU technologies. Analyze the economic viability, environmental impact, and policy support needed to move CCU from a niche to a mainstream solution.
4. “Current” (cluster name): The topic name may be an artifact of the clustering algorithm. Further analysis of the keywords and content of these articles is needed to identify the underlying theme.
Critical Considerations:
- Keyword Selection: The quality of the analysis depends on the quality of the keywords. Ensure keywords are consistently applied and reflect the core content of the publications.
- Database Bias: SCOPUS has its own biases in terms of journal coverage and indexing practices. Consider supplementing with other databases (Web of Science, etc.) for a more comprehensive view.
- Time Period: The analysis reflects the state of research at a specific point in time. Consider performing longitudinal analyses to track the evolution of these themes over time.
- Algorithm Sensitivity: Clustering algorithms can be sensitive to parameter settings. Experiment with different algorithms and parameters to ensure the results are robust.
By understanding the structure of the strategic map, the characteristics of each quadrant, and the specific clusters identified, you can gain valuable insights into the research landscape and identify promising areas for future investigation. Remember to critically evaluate the results in light of the data sources, parameters, and potential biases.
Factorial Analysis
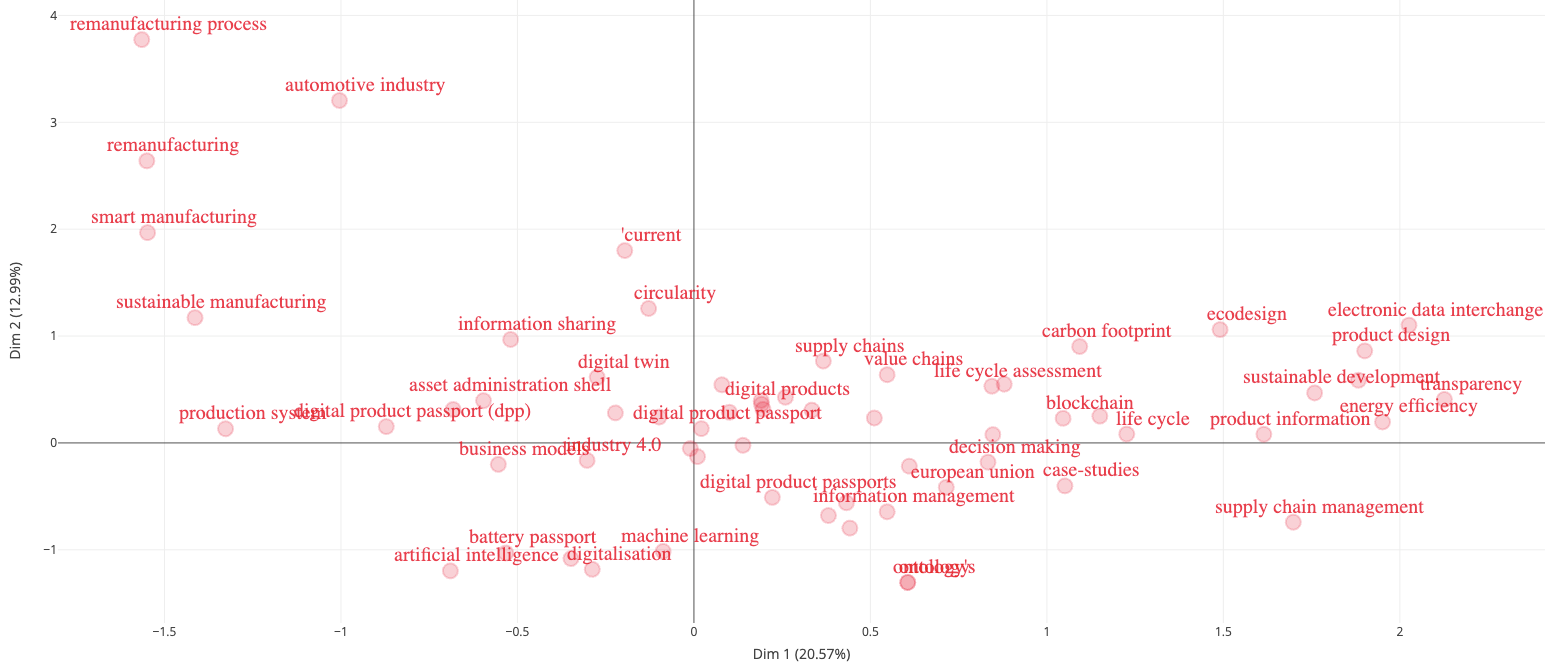
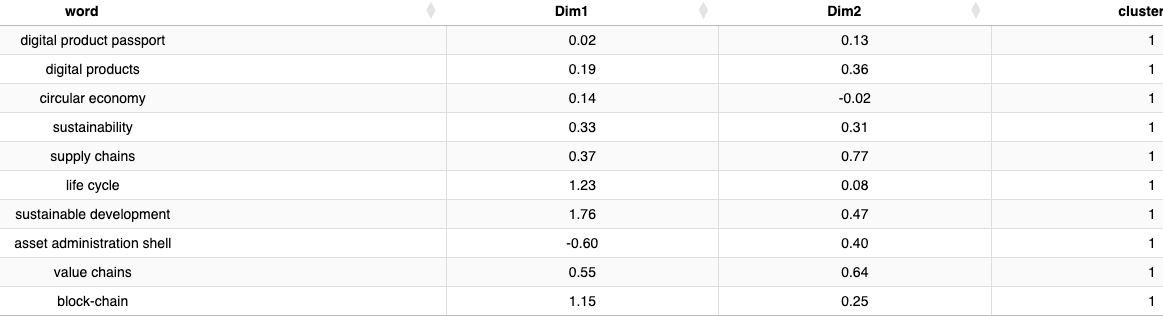
Okay, let’s break down this factorial map derived from the Scopus keyword analysis. This MCA (Multiple Correspondence Analysis) plot provides a visual representation of relationships between keywords within your research collection.
Overall Structure and Interpretation
- Axes and Variance: The plot displays two dimensions (Dim 1 and Dim 2). Dim 1 explains 20.57% of the variance, while Dim 2 explains 12.99%. This means Dim 1 captures a larger proportion of the differences between keywords than Dim 2. Together, these two dimensions account for roughly 33.56% of the total variance. While not exhaustive, this is a reasonable starting point for understanding the major themes. You should be mindful that there’s a substantial amount of variance not explained by these two dimensions, implying the presence of other underlying factors worth exploring in further analysis.
- Proximity and Association: Keywords that are close to each other on the map are more likely to appear together in the same documents (within the constraints imposed by your parameters like `minDegree`). Distance represents dissimilarity.
- Origin: The center of the plot represents the average profile of the dataset. Keywords near the center are less distinctive and appear more generally across the corpus.
Cluster Identification and Theme Interpretation
Given the `clust = 1` parameter, the plot isn’t explicitly displaying cluster assignments calculated by the algorithm. However, we can visually identify potential clusters based on proximity:
- Cluster 1: Remanufacturing and Automotive Industry (Top-Left Quadrant): The keywords “remanufacturing process,” “automotive industry,” “remanufacturing,” “smart manufacturing” and “sustainable manufacturing” are clustered together in the upper-left quadrant. This suggests a strong research focus on remanufacturing within the automotive sector, potentially relating to smart and sustainable manufacturing practices.
- Cluster 2: Digital Product Passports and Industry 4.0 (Center-Left): Keywords like “digital product passport,” “digital twin,” “asset administration shell,” “Industry 4.0,” and “information sharing” form a cluster. This suggests a theme around the digitalization of product information, enabling greater traceability, and aligns with Industry 4.0 concepts.
- Cluster 3: Sustainability and Life Cycle Assessment (Center-Right to Right): A cluster appears to be formed around “supply chains,” “value chains,” “life cycle assessment,” “carbon footprint,” “ecodesign,” “sustainable development,” “energy efficiency,” “transparency” and “product information.” This represents a focus on environmental sustainability, circular economy principles, and assessing the environmental impact of products throughout their life cycle.
- Cluster 4: Emerging Technologies (Bottom): The terms “battery passport,” “machine learning,” “artificial intelligence,” “digitalisation,” and “ontology’s” form a cluster. This indicates a research stream investigating the use of emerging technologies to enable circular economy and sustainability, with potential application in passporting and digitalizing product-related data.
- Individual keywords: The placement of ‘current’ near the origin suggests that these terms are widely used across different research topics within the dataset and might act as bridging concepts between the different clusters.
Key Contributing Terms:
- High Positive on Dim 1 (Right Side): Keywords like “product design,” “electronic data interchange,” “sustainable development,” and “transparency” are highly positive on Dim 1. This suggests Dim 1 captures a contrast between themes that strongly emphasize sustainability, transparency, and data integration.
- High Negative on Dim 1 (Left Side): “Remanufacturing process,” “remanufacturing”, “smart manufacturing” have negative values on Dim 1. This possibly represents a contrast against Dim 1, focusing on manufacturing and process innovation.
- High Positive on Dim 2 (Top): “Remanufacturing process,” “automotive industry,” “remanufacturing,” and “smart manufacturing” are highly positive on Dim 2. This dimension possibly captures themes related to manufacturing and reuse.
- High Negative on Dim 2 (Bottom): “Ontology’s,” “machine learning,” and “artificial intelligence” are highly negative on Dim 2. This suggests an opposition on Dim 2 between emerging tech and manufacturing.
Interpretation & Further Investigation
This MCA plot reveals key thematic areas within your Scopus dataset:
1. Remanufacturing in Automotive: A strong focus on remanufacturing, particularly within the automotive industry.
2. Digitalization for Traceability: Emphasis on digital product passports and digital twins for enhanced product data management.
3. Sustainability & LCA: Research centered on assessing and improving the environmental sustainability of products.
4. Emerging Technologies: Exploration of AI, machine learning, and ontologies for supporting circular economy initiatives.
Further Actions & Critical Considerations
- Parameter Sensitivity: Consider rerunning the analysis with different parameters, especially `minDegree`. A higher `minDegree` will focus on keywords with stronger co-occurrence, potentially revealing more robust thematic clusters. Experimenting with `k.max` (number of clusters) might also refine the cluster definitions.
- Stemming: Consider rerunning the analysis with `stemming = TRUE`. This might consolidate keywords with similar roots, giving a clearer picture of the underlying themes.
- Database Scope: Remember that this analysis is based on your specific Scopus collection. The thematic landscape might differ significantly with a broader search or different database.
- Qualitative Analysis: This bibliometric analysis provides a high-level overview. Supplement it with qualitative analysis of the key papers within each cluster to gain deeper insights into the research questions, methodologies, and findings.
- Limitations of MCA: MCA assumes a chi-squared distance metric, which might not always be the most appropriate measure of association between keywords. Be mindful of this when interpreting the results. The relatively low percentage of variance explained suggests that many factors are at play, and the relationships are complex.
By critically evaluating this factorial map and considering these points, you can develop a robust understanding of the research landscape and identify promising avenues for further investigation.
Co-citation Network
Historiograph
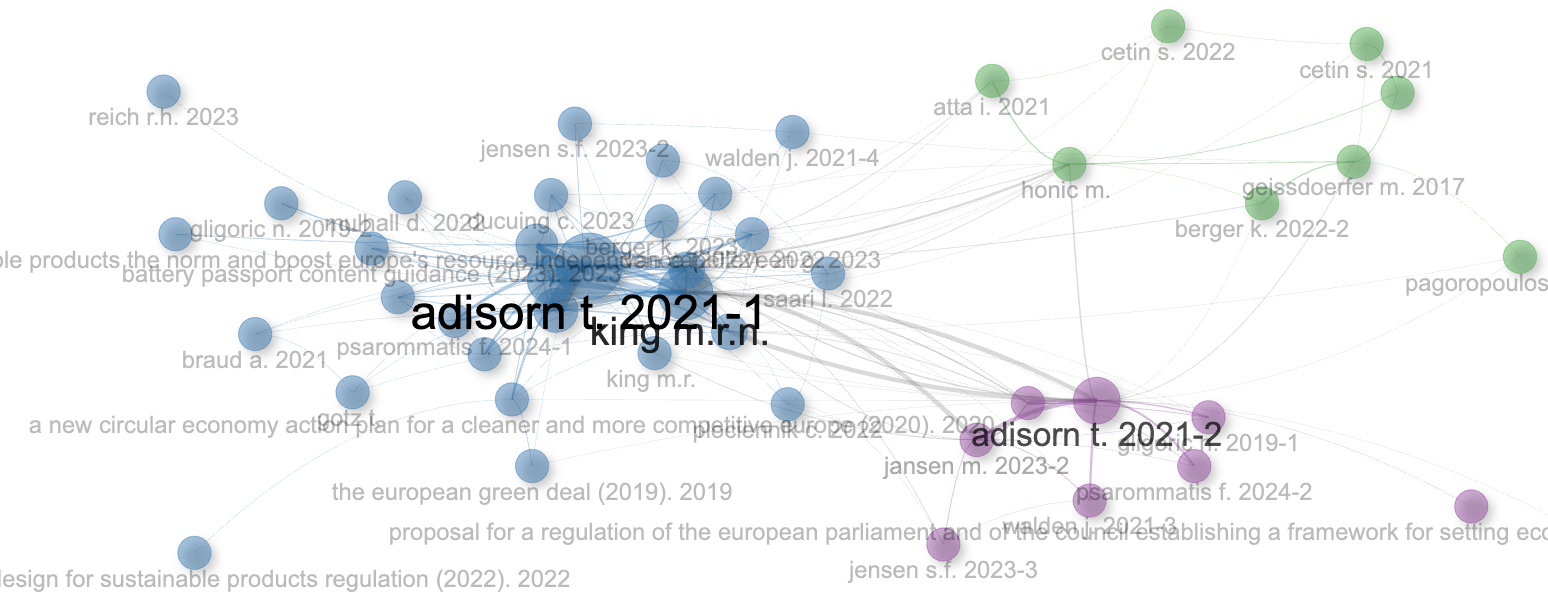
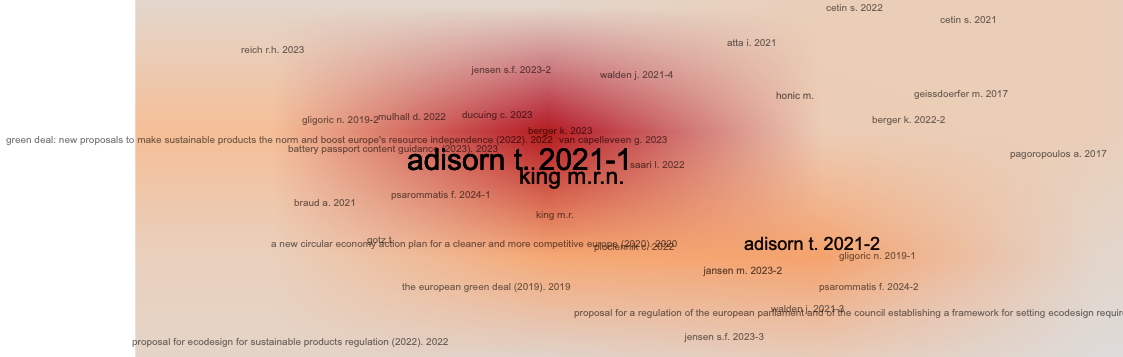
Okay, let’s break down this co-citation network and interpret its key features.
Overall Structure:
The network appears to be relatively sparse, meaning that the cited references have a limited number of co-citation links between them. There isn’t a single, highly dominant central node pulling everything together. Instead, we see a few clusters of references indicating distinct (but potentially related) research areas or conversations.
Community Detection (Walktrap Algorithm):
The Walktrap algorithm has identified at least four communities, represented by different colors (blue, purple, green and red). This is very important because it means you can classify the co-cited references into some clear themes.
- Blue Cluster: This appears to be the largest and most central community. Given that the terms “adisorn t. 2021-1” and “king m.r.m.” show up in this cluster, this could be referring to some central research articles. The presence of “green deal,” “battery passport,” “circular economy action plan,” and “proposal for ecodesign for sustainable products regulation” suggests this cluster revolves around recent EU initiatives and policy discussions related to sustainable product design, the circular economy, and battery regulation.
- Purple Cluster: This cluster includes the reference “adisorn t. 2021-2”, it will be useful to look at what connects the ‘adisorn’ publications. Other terms such as “arommatis 1. 2024-2,” “jensen m. 2023-2,” and references to establishing a framework for setting ecodesign requirements. This community seems to be centered on the technical implementation and establishment of ecodesign frameworks.
- Green Cluster: This cluster includes authors such as “Cetin” and “Berger”. This may point to a slightly earlier body of research influencing the more recent policy and framework discussions. “Pagoropoulos a. 2017” confirms that this cluster is not as recent as the other clusters.
- Red Cluster: This small cluster, contains terms directly related to “regulation (eu).” and “commission regulation (eu).” This appears to highlight a specific focus on actual EU regulatory texts and their impact.
Most Connected Terms:
Identifying the “most connected” terms (nodes with the highest degree centrality) in each cluster would be crucial. Based on the zoomed-in images, the most central cited references appear to be:
- “adisorn t. 2021-1” and “adisorn t. 2021-2”: These are clearly central figures within the network, especially within the blue and purple clusters. This suggests their work is highly influential in the field, serving as a bridge between different areas (e.g., policy, framework development). Investigating these publications should provide valuable context.
- “king m.r.m.”: The centrality of this term within the blue cluster reinforces the importance of battery passport and ecodesign policy related research in the current literature.
Interpretation & Discussion Points:
1. Policy Focus: The prominence of terms like “green deal,” “battery passport,” “circular economy,” and “proposal for ecodesign” indicates a strong focus on the policy landscape surrounding sustainable product design and circular economy initiatives within the EU. The research in this area is highly driven by and focused on these emerging regulations.
2. Framework Implementation: The presence of a separate cluster centered on “establishing a framework for setting ecodesign requirements” (purple cluster) suggests a distinct research thread focused on the practical implementation and technical details of ecodesign regulations. This may include methodological development or case studies exploring the application of these frameworks.
3. Bridging Policy and Practice: The central role of “adisorn t. 2021-1” and “adisorn t. 2021-2” is interesting. It is highly likely that these articles are acting as central hubs in the area of Circular Economy. Understanding the content of these publications is essential for grasping the key themes.
4. Regulatory Impact: The existence of a small but distinct cluster focusing directly on EU regulations (“regulation (eu),” “commission regulation (eu)”) suggests that some research is specifically analyzing or commenting on the impact and implications of these regulations.
5. Temporal Trends: It will be worth investigating if the work in the green cluster provides the theoretical foundations for the other, more recent, clusters.
Critical Discussion Guidance:
- Scope & Limitations: Consider if the Scopus database adequately captures the entire body of relevant literature. Are there other databases that might provide a broader perspective?
- Citation Bias: Be aware that citation patterns can be influenced by factors other than the inherent quality or importance of a work (e.g., author reputation, journal visibility).
- Emerging Trends: Discuss the potential implications of the identified trends for future research and policy development in the field.
Next Steps:
1. Examine Key Publications: The most crucial step is to actually read the publications by “adisorn” and “king m.r.m.” Their abstracts and key findings will provide significant context for interpreting the network.
2. Explore the Clusters: Investigate the articles within each cluster more closely to identify the specific research questions, methodologies, and findings associated with each theme.
3. Temporal Analysis: Consider adding a temporal dimension to the analysis (e.g., overlaying publication years on the network) to understand how these research areas have evolved over time.
By following these steps, you can move beyond a descriptive overview of the co-citation network to a more in-depth and critical interpretation of the research landscape. Good luck!
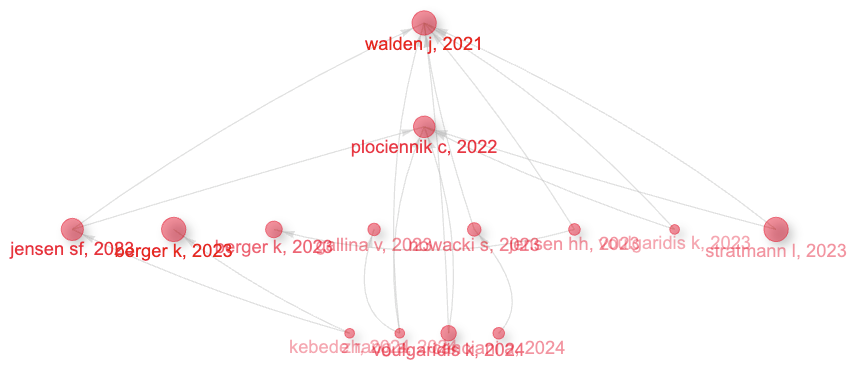
Historiograph
Okay, let’s analyze this historiograph focusing on the temporal evolution of research related to Digital Product Passports (DPPs) and the Circular Economy (CE).
Overall Observations:
- Temporal Span: The network spans from 2021 to 2024, indicating a relatively recent and rapidly evolving research area.
- Centrality: Walden (2021) appears to be a foundational work, having high centrality (i.e. having many connections), likely setting the stage by defining requirements for DPPs. The size of its node confirms this. Plociennik (2022) also appears to be very important, as it is highly connected to Walden and several other subsequent works.
- Clustering: While a clear-cut visual clustering isn’t apparent due to the limited number of nodes, we can infer some thematic groups based on citation patterns and article titles.
Key Citation Paths and Pivotal Works:
1. Foundational Layer (2021-2022):
* Walden (2021): “Requirements For A Digital Product Passport To Boost The Circular Economy” – This paper’s high centrality suggests it likely defined the core requirements and concepts of DPPs for CE. It acts as a central reference point.
* Plociennik (2022): “The Method Of Forming And Using A Digital Passport For An Electronic Product At Enterprises Of The Instrument-Making Industry” – This work seems to build upon Walden (2021), likely providing a more practical, method-oriented approach, specifically focusing on electronic products within instrument-making industries.
2. Expansion and Specialization (2023):
* A significant number of papers published in 2023 broaden the scope and application of DPPs:
* Berger (2023): (Two papers) These papers likely investigate the practical implementation and research direction of DPPs in the CE.
* Nowacki (2023): “Information-Based Plastic Material Tracking For Circular Economy—A Review” – This work provides a review on material tracking for the CE, suggesting a focus on the DPP to enhance circularity and material management.
* Gallina (2023): “Circularity And Lca – Material Pathways: The Cascade Potential And Cascade Database Of An In-Use Building Product” – This indicates a focus on the built environment and using DPPs for LCA (Life Cycle Assessment) and material flow analysis.
* Jensen (2023): (Two papers) These papers explore the development and implementation of DPPs, contributing to their adaptation for the CE.
* Stratmann (2023): “Textile Industry Circular Supply Chains And Digital Product Passports. Two Case Studies” – Focus on DPPs in the textile industry, suggesting industry-specific applications are emerging.
* Voulgaridis (2023): “No-One Left Behind: An Open Access Approach To Estimating The Carbon Footprint Of A Danish Clothing Company” – This paper likely explores the use of data, possibly facilitated by DPPs, to estimate carbon footprints, emphasizing transparency.
3. Further Development and Application (2024):
* The 2024 publications show a continuation of the trend towards specific applications and technological implementations:
* Canciani (2024): “Building A Sustainable Battery Supply Chain With Digital Battery Passports” – Specifically addresses battery supply chains, indicating a growing interest in using DPPs for managing critical components.
* Kebede (2024): “Research On A Saas (Software As A Service)-Based Digital Product Passport System Model For The Ev Battery Industry Value Chain” – Focuses on a SaaS-based DPP system for the EV battery industry, reflecting a move towards concrete technological solutions.
* Voulgaridis (2024): “Digital Circular Ecosystems: A Data Governance Approach” – This paper shifts towards broader ecosystems and data governance aspects of DPPs, suggesting a focus on managing data flow and interoperability.
* Zhang (2024): “Quantitative Benefits Of The Digital Product Passport And Data Sharing In Remanufacturing” – Focuses on quantifying the benefits of DPPs in the context of remanufacturing, indicating a push for demonstrating the economic value.
Temporal Trends in Knowledge Development:
- 2021: Establishment of the foundational requirements for DPPs.
- 2022: Development of practical methods for implementing DPPs, focusing on specific industries (e.g., electronic products).
- 2023: Broadening of the scope to various industries (textiles, building products, plastics), with a focus on material tracking, LCA, and carbon footprint estimation. The emergence of research agendas (Berger, 2023) indicates a maturing field.
- 2024: Focus on specific technological implementations (SaaS for EV batteries), data governance, and quantifying the benefits of DPPs in areas like remanufacturing and battery supply chains.
Interpretation and Discussion Points for Researchers:
1. The rapid growth of publications suggests a high level of interest and activity in this area. The field is moving quickly from conceptualization to implementation.
2. Walden’s work (2021) is a key starting point. Researchers should be familiar with its defined requirements as a basis for their own work.
3. The shift towards industry-specific applications (textiles, batteries) highlights the need for tailored DPP solutions. Generic DPP frameworks may not be sufficient.
4. The increasing emphasis on data governance and quantification of benefits suggests a move towards demonstrating the practical value and scalability of DPPs. Focus should be given to these aspects to make the solutions more feasible.
5. The connection to LCA and carbon footprint estimation demonstrates the potential of DPPs to contribute to broader sustainability goals.
6. The focus on EV batteries indicates the importance of DPPs for managing critical materials and ensuring the sustainability of emerging technologies.
Further Research Directions:
- Interoperability: As DPPs are implemented across different industries and supply chains, research on data standards and interoperability will be crucial.
- Data Security and Privacy: The vast amount of data collected through DPPs raises concerns about security and privacy. Research is needed to develop appropriate data governance frameworks.
- Scalability: How can DPP systems be scaled to handle the complexity of global supply chains?
- Economic Viability: Further investigation into the economic benefits of DPPs is needed to encourage wider adoption.
This analysis provides a solid foundation for understanding the development of DPP research. By critically evaluating these trends and considering the suggested discussion points, researchers can better contextualize their work and contribute to the advancement of this important field. Remember to always access and read the full articles to perform a complete and accurate critical analysis.
Collaboration Network
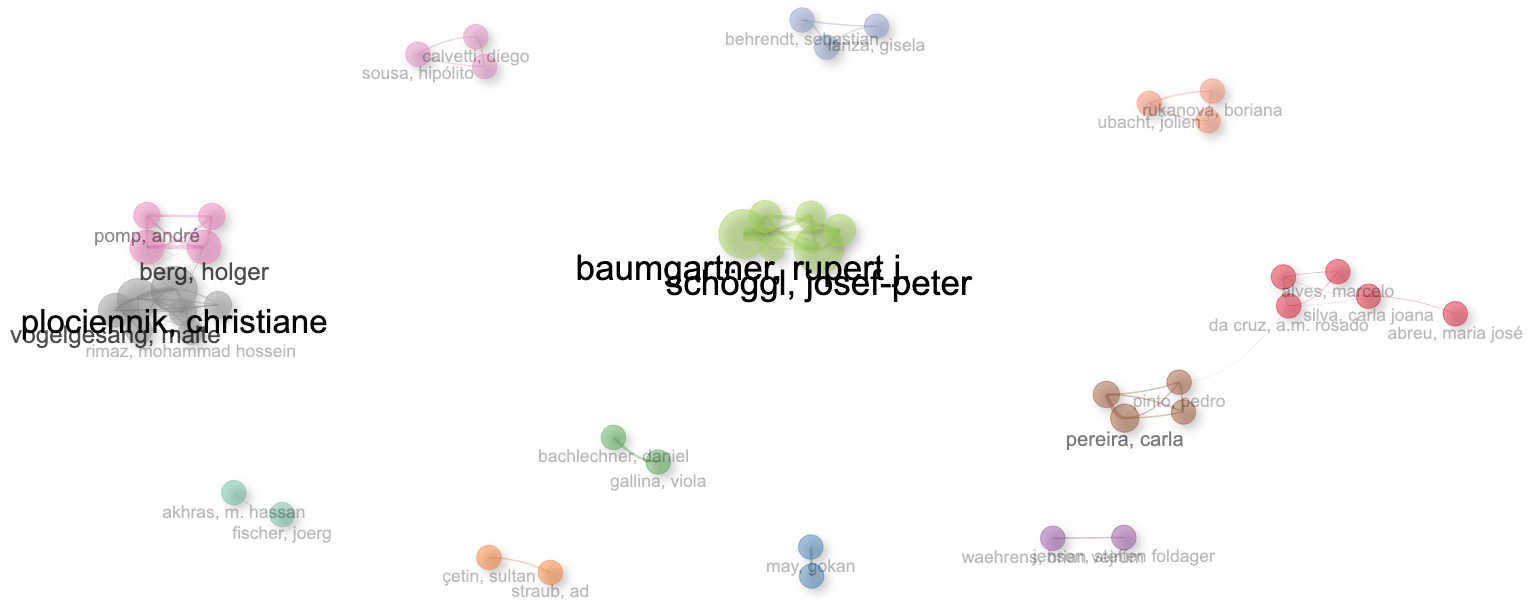
Okay, let’s break down the author collaboration network based on the provided image and parameters.
Overall Network Structure:
The network appears to be relatively sparse, meaning there aren’t a lot of connections between all authors in the dataset. It consists of several distinct clusters or communities, visually separated in the graph. This suggests that collaboration is happening more within specific groups than across the entire author pool. There are no connections between the communities.
Community Detection (Walktrap Algorithm):
The “walktrap” algorithm was used for community detection. This algorithm identifies communities by simulating random walks on the network. Authors that are frequently visited during these random walks are grouped together. The colors likely represent the different communities identified by the algorithm.
- The most connected authors, like “plociennik, christiane” are grouped together in the same community and are connected to other authors such as, “pomp, andré”, “berg, holger”, “vogelgesang, malte” and “rimaz, mohammad hossein”.
- The algorithm also detected communities formed by the authors “calvetti, diego”, “sousa, hipólito” and the community with the authors “baumgartner, rupert i.” and “Schoggi, Josef-peter”.
Relevance of Most Connected Authors (Label.n = 50):
The parameter “label.n = 50” indicates that the 50 most connected authors (nodes) are labeled. These authors are central within their respective communities.
- Authors like “plociennik, christiane” appear to be central players, potentially leading or coordinating research efforts within their community. They may be established researchers or have a wider network within the field.
- Similarly, authors “baumgartner, rupert i.” and “Schoggi, Josef-peter” are also highly connected. This indicates that these authors are the key members of their community.
Interpretation of Other Parameters:
- Normalization (Association): The “association” normalization method likely emphasizes collaborations where the authors frequently co-author publications, relative to their overall publication frequency. This means that a strong link indicates a strong preference for collaboration.
- Edge Size (Edgesize = 15, Edges.min = 1): The edge thickness represents the strength of the collaboration.
- Layout: While the precise layout algorithm isn’t specified, the arrangement of nodes suggests an attempt to visually separate clusters and minimize edge crossings, improving readability.
- Removing Isolates: The “remove.isolates = TRUE” parameter ensures that authors without any co-authorships within the analyzed dataset are excluded from the graph. This focuses the analysis on active collaboration networks.
Critical Discussion & Potential Further Investigations:
1. Domain Specialization: The distinct communities might reflect different sub-fields or research areas within the broader scope of the Scopus collection. You could investigate the keywords associated with the publications of each community to understand their thematic focus.
2. Collaboration Barriers: The lack of connections between communities could indicate barriers to interdisciplinary collaboration. Are there institutional, geographical, or methodological reasons for these separations?
3. Funding and Research Groups: The communities could correspond to specific research groups or projects funded by particular grants. Investigating funding sources might provide additional context.
4. Evolution of Collaboration: This is a static snapshot. Analyzing collaboration networks over time could reveal how these communities have evolved, merged, or fragmented.
5. Centrality Measures: While node size provides a visual representation of degree centrality (number of connections), calculating other centrality measures (e.g., betweenness centrality, closeness centrality) could identify authors who act as bridges between communities or who have particularly efficient access to the network.
In summary, this author collaboration network reveals a segmented landscape of research collaborations within the Scopus dataset. Certain authors act as central nodes within their communities, while overall inter-community collaboration appears limited. Further investigation into the thematic focus of each community and the reasons for the lack of connections between them would provide a more comprehensive understanding of the research landscape.
Countries’ Collaboration World Map
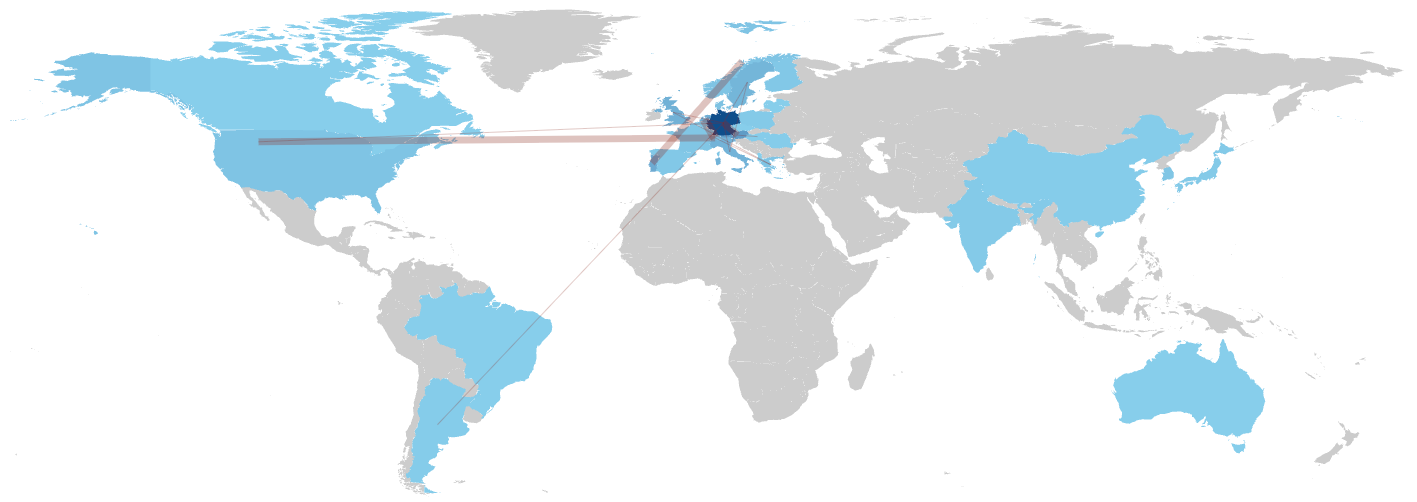
Okay, let’s analyze this “Countries’ Collaboration World Map” generated from your SCOPUS data.
Overall Observations:
- Visual Representation: The map uses color intensity to represent the total number of articles originating from each country, indicating research output. The lines connecting countries represent co-authorship collaborations.
- Data Source: The data comes from SCOPUS, a large abstract and citation database of peer-reviewed literature. This is important to note because the coverage of SCOPUS can influence the results (e.g., some languages or regions might be less well-represented than others).
- Co-authorship Definition: Collaboration is defined by co-authorship across *all* authors, not just corresponding authors. This means even a single co-authored paper between researchers in two different countries will create a collaborative link.
Key Findings and Interpretations:
1. Major Hubs of Scientific Production:
* United States: The USA appears to be a major hub of scientific production.
* China: China also seems to have a substantial amount of research output.
* Europe: Several European countries, especially Germany and other nations in Western Europe, demonstrate significant research activity.
*In general, these observations are expected, since developed countries have better infrastructure and research funds*.
2. Key International Partnerships:
* Transatlantic Collaboration: A strong collaboration link exist between Germany and the USA.
*This highlights important knowledge transfer between these countries.*
3. Global Patterns of Collaboration:
* Western Dominance: Based on color intensity, the majority of high-output research seems to be concentrated in North America, Europe, and parts of Asia and Oceania.
* Limited African Representation: Note the comparatively low output from African countries. This could reflect lower research funding, limited infrastructure, or, potentially, underrepresentation of African publications in the SCOPUS database.
Critical Discussion Points:
- Data Bias: Always acknowledge the potential for bias in bibliographic databases like SCOPUS. While comprehensive, they may not perfectly capture all research output globally. Language bias (favoring English-language publications), publication bias (favoring certain journals or regions), and coverage bias (omitting certain types of publications) are all possibilities to consider.
- Causation vs. Correlation: Co-authorship indicates collaboration, but it doesn’t necessarily imply the *quality* or *impact* of that collaboration. A large number of collaborations might indicate significant activity but not necessarily significant advances.
- Normalization: When comparing countries, it’s essential to consider factors such as population size, GDP, and R&D investment. A country with a smaller population may have fewer publications overall, but its per-capita research output might be very high. Normalization techniques in bibliometrics can help account for these differences.
- Network Structure: This map only shows the *existence* of collaborations. Analyzing the underlying network structure (e.g., identifying centrality measures) could provide deeper insights into which countries play a central role in the global research network and how information flows within the network.
- Temporal Trends: This is a static snapshot. Examining changes in collaboration patterns over time would be very valuable. Are certain collaborations increasing or decreasing in intensity? Are new collaborations emerging?
- Contextual Knowledge: Use your expert knowledge of the specific research area covered by your SCOPUS dataset to interpret these patterns. Are the observed collaborations logical based on the locations of leading research institutions or specific scientific programs? Are there geopolitical factors that might be influencing collaboration patterns?
Next Steps for the Researcher:
1. Further Refinement: If possible, filter the dataset to focus on specific research areas or time periods. This will provide a more focused and nuanced picture of collaboration patterns.
2. Network Analysis: Conduct a more formal network analysis to quantify the strength and characteristics of international collaborations.
3. Qualitative Analysis: Consider supplementing the bibliometric analysis with qualitative data (e.g., interviews with researchers) to gain deeper insights into the motivations and challenges of international collaboration.
4. Comparison to Other Datasets: Compare your findings to similar analyses using other bibliographic databases (e.g., Web of Science) to assess the robustness of your results.
By carefully considering these points, you can transform this initial visualization into a compelling and informative account of international scientific collaboration within your research domain.