2020-2026
“Article”
“English”
Resultados: 9371
Overall Assessment:
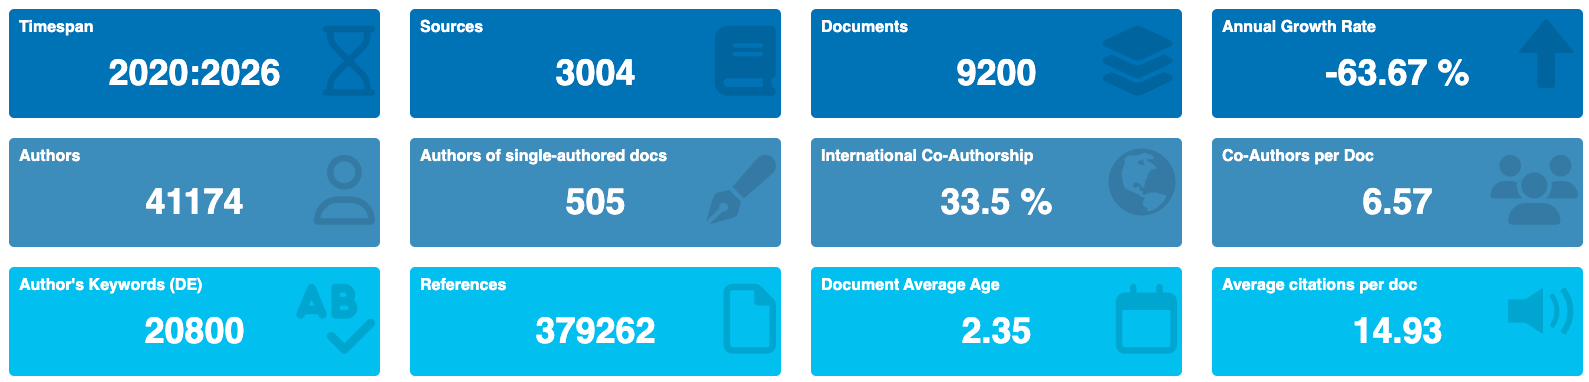
The dataset represents a substantial collection of research publications (9200 documents) indexed by SCOPUS, spanning from 2020 to 2026. This gives us a relatively recent snapshot of research activity. However, the significant negative annual growth rate suggests a sharp decline in the number of publications indexed in this particular collection in the later years. We need to investigate the reasons for this decline (e.g., changes in search query, database coverage, or actual decrease in research output in the specific field). Despite the recent nature of the data, the average document age is 2.35 years.
Scope and Breadth (Documents & Sources):
* Documents (9200): A collection of 9200 documents indicates a sizable body of research. This allows for meaningful bibliometric analysis and identification of trends. The value is sufficiently large to draw conclusions with appropriate caveats.
* Sources (3004): The research stems from a wide array of sources (journals, books, conference proceedings, etc.). This suggests that the research area covered by the collection is interdisciplinary and drawing knowledge from a variety of disciplines.
* Timespan (2020-2026): Relatively recent data, capturing current trends. However, the short timespan might limit the observation of long-term impact.
* Annual Growth Rate (-63.67%): This is a critical observation. A large negative growth rate could indicate:
* Narrowing of Search Criteria: The criteria used to create this collection may have become more restrictive over time, resulting in fewer documents being included.
* Database Changes: SCOPUS’s coverage or indexing practices may have changed, leading to fewer documents being captured.
* Genuine Decrease in Research Output: The research area may be genuinely experiencing a decline in publication activity. This would require further investigation into external factors (funding cuts, shift in research focus, etc.).
* Data Incompleteness: The later years of the dataset may be incomplete.
Productivity and Collaboration (Authors & Documents):
- Authors (41174): A large number of authors contributing to the collection indicates a vibrant research community and suggests broad participation in the field.
- Single-Authored Docs (528): The presence of single-authored documents (528) indicates that there are still individual contributions to the field but are low with respect to the total amount of documents.
- Co-Authors per Doc (6.57): The high number of co-authors per document (6.57) points to a highly collaborative research environment. This is typical of many scientific fields today, where projects are complex and require diverse expertise. This also suggests that some of the publications are the results of a large team.
- International Co-authorships (33.5%): A third of all publications are the results of international collaborations. This reflects a globalized research landscape. International collaboration often leads to higher impact publications and knowledge transfer.
Impact and Influence (Citations):
- Average Citations per Doc (14.93): An average of 14.93 citations per document indicates a moderate level of impact for the collection as a whole. This is a key metric to compare with other collections in similar fields and timeframes.
- References (379262): The large number of references (379262) indicates that the research is well-grounded in existing literature and draws upon a broad knowledge base.
Content Analysis (Keywords):
- Keywords Plus (ID) (30050): Keywords Plus are terms automatically extracted from the titles of cited articles. A high number suggests a diverse range of related topics and potentially interdisciplinary connections.
- Author’s Keywords (DE) (20800): Author-supplied keywords represent the researchers’ own framing of their work. This number reflects the variety of concepts and topics investigated within the collection.
Document Type:
- Article (9198): Overwhelmingly dominated by journal articles. This is expected for a SCOPUS collection and should be kept in mind when comparing to collections from other databases.
Critical Discussion Points & Further Investigation:
- The Negative Growth Rate: This is the most concerning aspect. Investigate *why* the growth rate is so negative. Look at the number of publications per year directly from the data to understand the trend. Consider possible explanations related to the query used to retrieve the data, database coverage, and genuine trends in the research area.
- Citation Distribution: The average citation rate can be misleading. Investigate the *distribution* of citations. Are there a few highly cited papers driving the average, or is there a more even spread? A citation analysis, including identifying the most cited papers, would be beneficial.
- Field Context: The “Average citations per doc” figure (14.93) is meaningless without comparing it to a benchmark for the specific field. Research norms for citation rates vary widely across disciplines.
- Keyword Analysis: Perform a more in-depth keyword analysis to identify the dominant themes, emerging trends, and potential research gaps. Network analysis of keywords can reveal relationships between different research areas.
- Source Analysis: Which journals and sources are contributing the most publications and citations? This can reveal the leading outlets in the field.
- Author Analysis: Identify the most prolific and influential authors. Analyze their collaboration networks.
- SCOPUS Bias: Remember that this data is from SCOPUS. SCOPUS has its own biases in terms of journal coverage (e.g., favoring English-language publications). Consider whether this might affect the representation of research in specific regions or languages.
In summary, this bibliometric analysis provides a starting point for understanding the scope, productivity, and impact of the research collection. However, a more in-depth investigation is needed to address the concerning negative growth rate and to contextualize the findings within the specific research area represented by the collection. The data suggests a collaborative and moderately impactful research area, but further investigation is vital before drawing definitive conclusions. Remember to always acknowledge the limitations of the data and the inherent biases of bibliographic databases.
| MAIN INFORMATION ABOUT DATA | |
| Timespan | 2020:2026 |
| Sources (Journals, Books, etc) | 3004 |
| Documents | 9200 |
| Annual Growth Rate % | -63.67 |
| Document Average Age | 2.35 |
| Average citations per doc | 14.93 |
| References | 379262 |
| DOCUMENT CONTENTS | |
| Keywords Plus (ID) | 30050 |
| Author’s Keywords (DE) | 20800 |
| AUTHORS | |
| Authors | 41174 |
| Authors of single-authored docs | 505 |
| AUTHORS COLLABORATION | |
| Single-authored docs | 528 |
| Co-Authors per Doc | 6.57 |
| International co-authorships % | 33.5 |
| DOCUMENT TYPES | |
| 1 | |
| md) | 1 |
| article | 9198 |
| 2020 | 1305 |
| 2021 | 1365 |
| 2022 | 1529 |
| 2023 | 1506 |
| 2024 | 2034 |
| 2025 | 1457 |
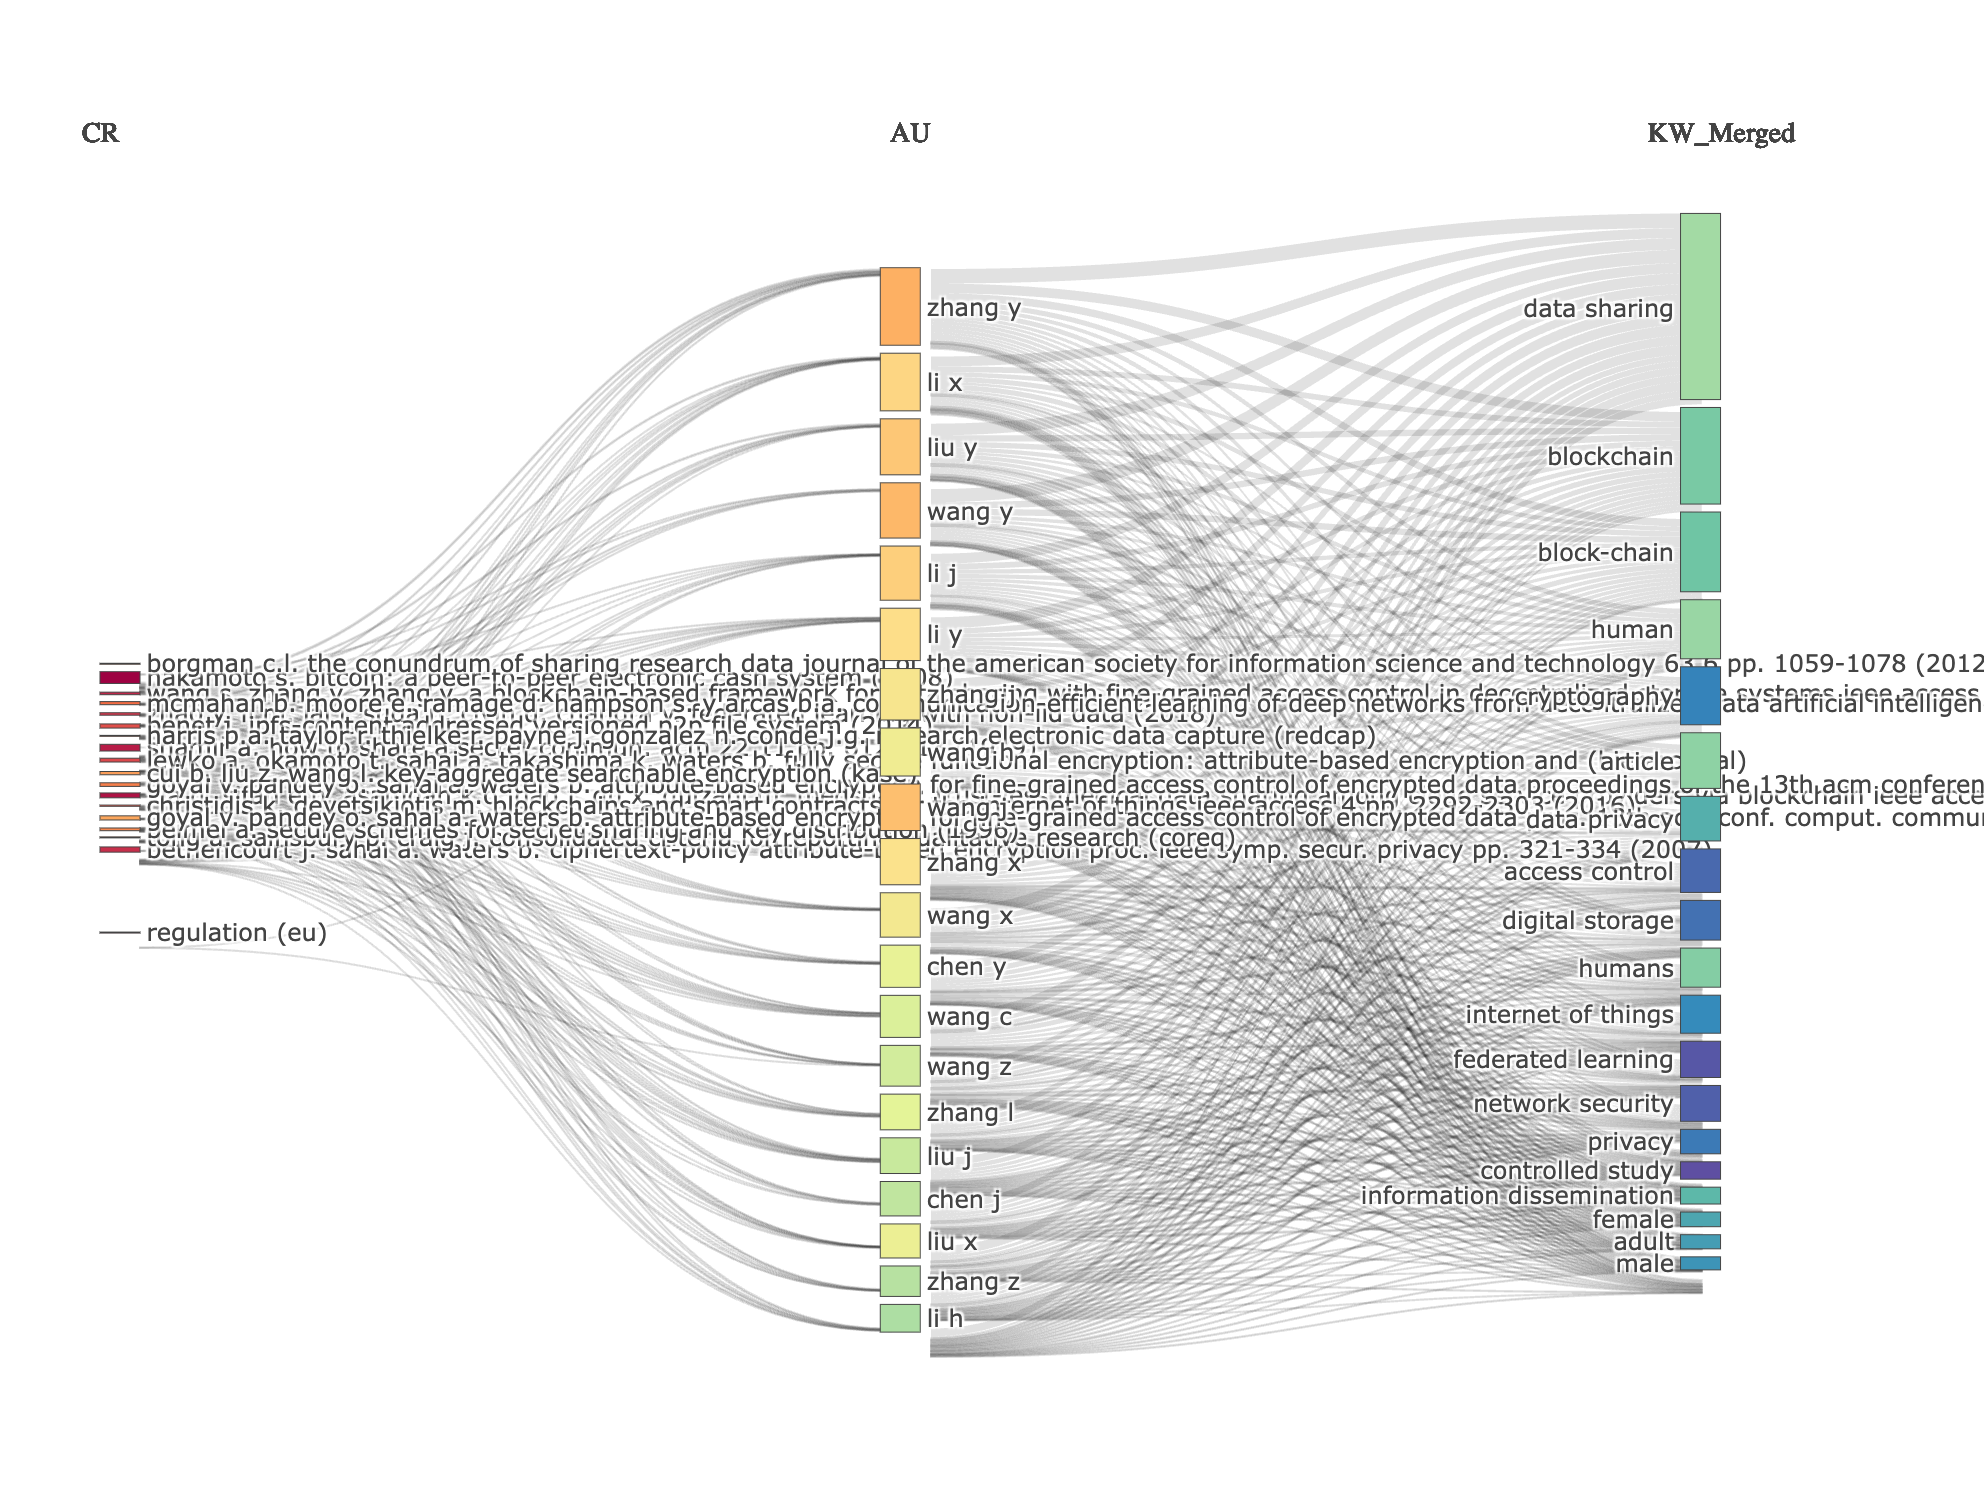
Three-Field Plot
Overall Structure and Purpose
The plot visualizes the relationships between three key elements of your research collection:
- CR (Cited References – Left Field): Represents the influential works or sources cited by the publications in your collection. These are the foundational papers, methodologies, or data sources upon which the research builds.
- AU (Authors – Center Field – Target): Shows the authors who have published in the collection. This is the central point of the analysis, connecting authors to both their cited references and the keywords associated with their work.
- KW_Merged (Merged Keywords – Right Field): Represents the keywords (author-supplied, index keywords, or a combination) associated with the publications in the collection. These indicate the specific topics, methods, or technologies discussed in the research.
Interpretation Strategy
The plot shows how authors connect to cited references and to specific keywords:
1. Author Centrality: Authors with the most connections will appear higher in the central “AU” column, indicating greater activity or influence within the research area represented by the collection.
2. Keyword Clusters: Groups of keywords that frequently appear together suggest distinct sub-topics or research themes within the collection.
3. Citation Patterns: The connections from authors to cited references reveal which foundational works are most influential in their research. Heavily cited references point to key concepts, methodologies, or datasets used in the field.
Specific Observations from the Image
- Prominent Authors: The authors at the top of the ‘AU’ column such as ‘zhang y’, ‘li x’, ‘liu y’, and ‘wang y’ have the highest number of connections. This implies that these authors are central figures in this research area, based on the documents in your SCOPUS collection.
- Key Research Topics: The ‘KW_Merged’ column reveals that “data sharing”, “blockchain” and “block-chain” are popular keywords. The link between “data sharing” and the authors in the ‘AU’ column suggests that data sharing is a key area of research for these authors.
- Influential Cited References: The ‘CR’ column provides insights into the most influential works. ‘borgman cl. the conundrum of sharing research data journal of the…’ and ‘nakamoto’s…’ appear to be cited frequently. This suggests that these works are fundamental to the research presented in your collection.
- Author-Keyword Relationships: Analyzing the connections between authors and keywords reveals the specific areas each author is working on. For example, some authors might be working specifically on “data sharing” while others focus on “blockchain.”
Possible Research Questions and Follow-up Analyses
Based on this initial interpretation, you might ask the following questions:
- What are the specific contributions of authors ‘zhang y’, ‘li x’, ‘liu y’, and ‘wang y’ to the fields of “data sharing” and “blockchain?” You could examine the content of their publications to identify specific research problems, methodologies, or findings.
- What are the main topics covered in the papers that cite the works of ‘borgman cl.’ and ‘nakamoto’s’? You could analyze the keywords of these citing papers to identify the specific contexts in which these works are influential.
- Are there distinct clusters of authors working on different sub-topics within the broader field? You could perform a community detection analysis on the author co-citation network to identify research groups or collaborations.
Recommendations for Further Exploration
1. Filter the Data: Refine your analysis by filtering the data based on publication year, document type, or other relevant criteria to focus on specific trends or subfields.
2. Inspect the Publications: Read the abstracts and full text of highly connected publications to gain a deeper understanding of the research questions, methodologies, and findings.
3. Consider alternative plots: Try another method of co-occurrence. It might provide new insights.
By using this interpretation as a starting point, you can delve deeper into your bibliometric data and gain valuable insights into the structure and evolution of your research field. Remember to consider the context of your research question and the limitations of the data when drawing conclusions.
Most Relevant Sources
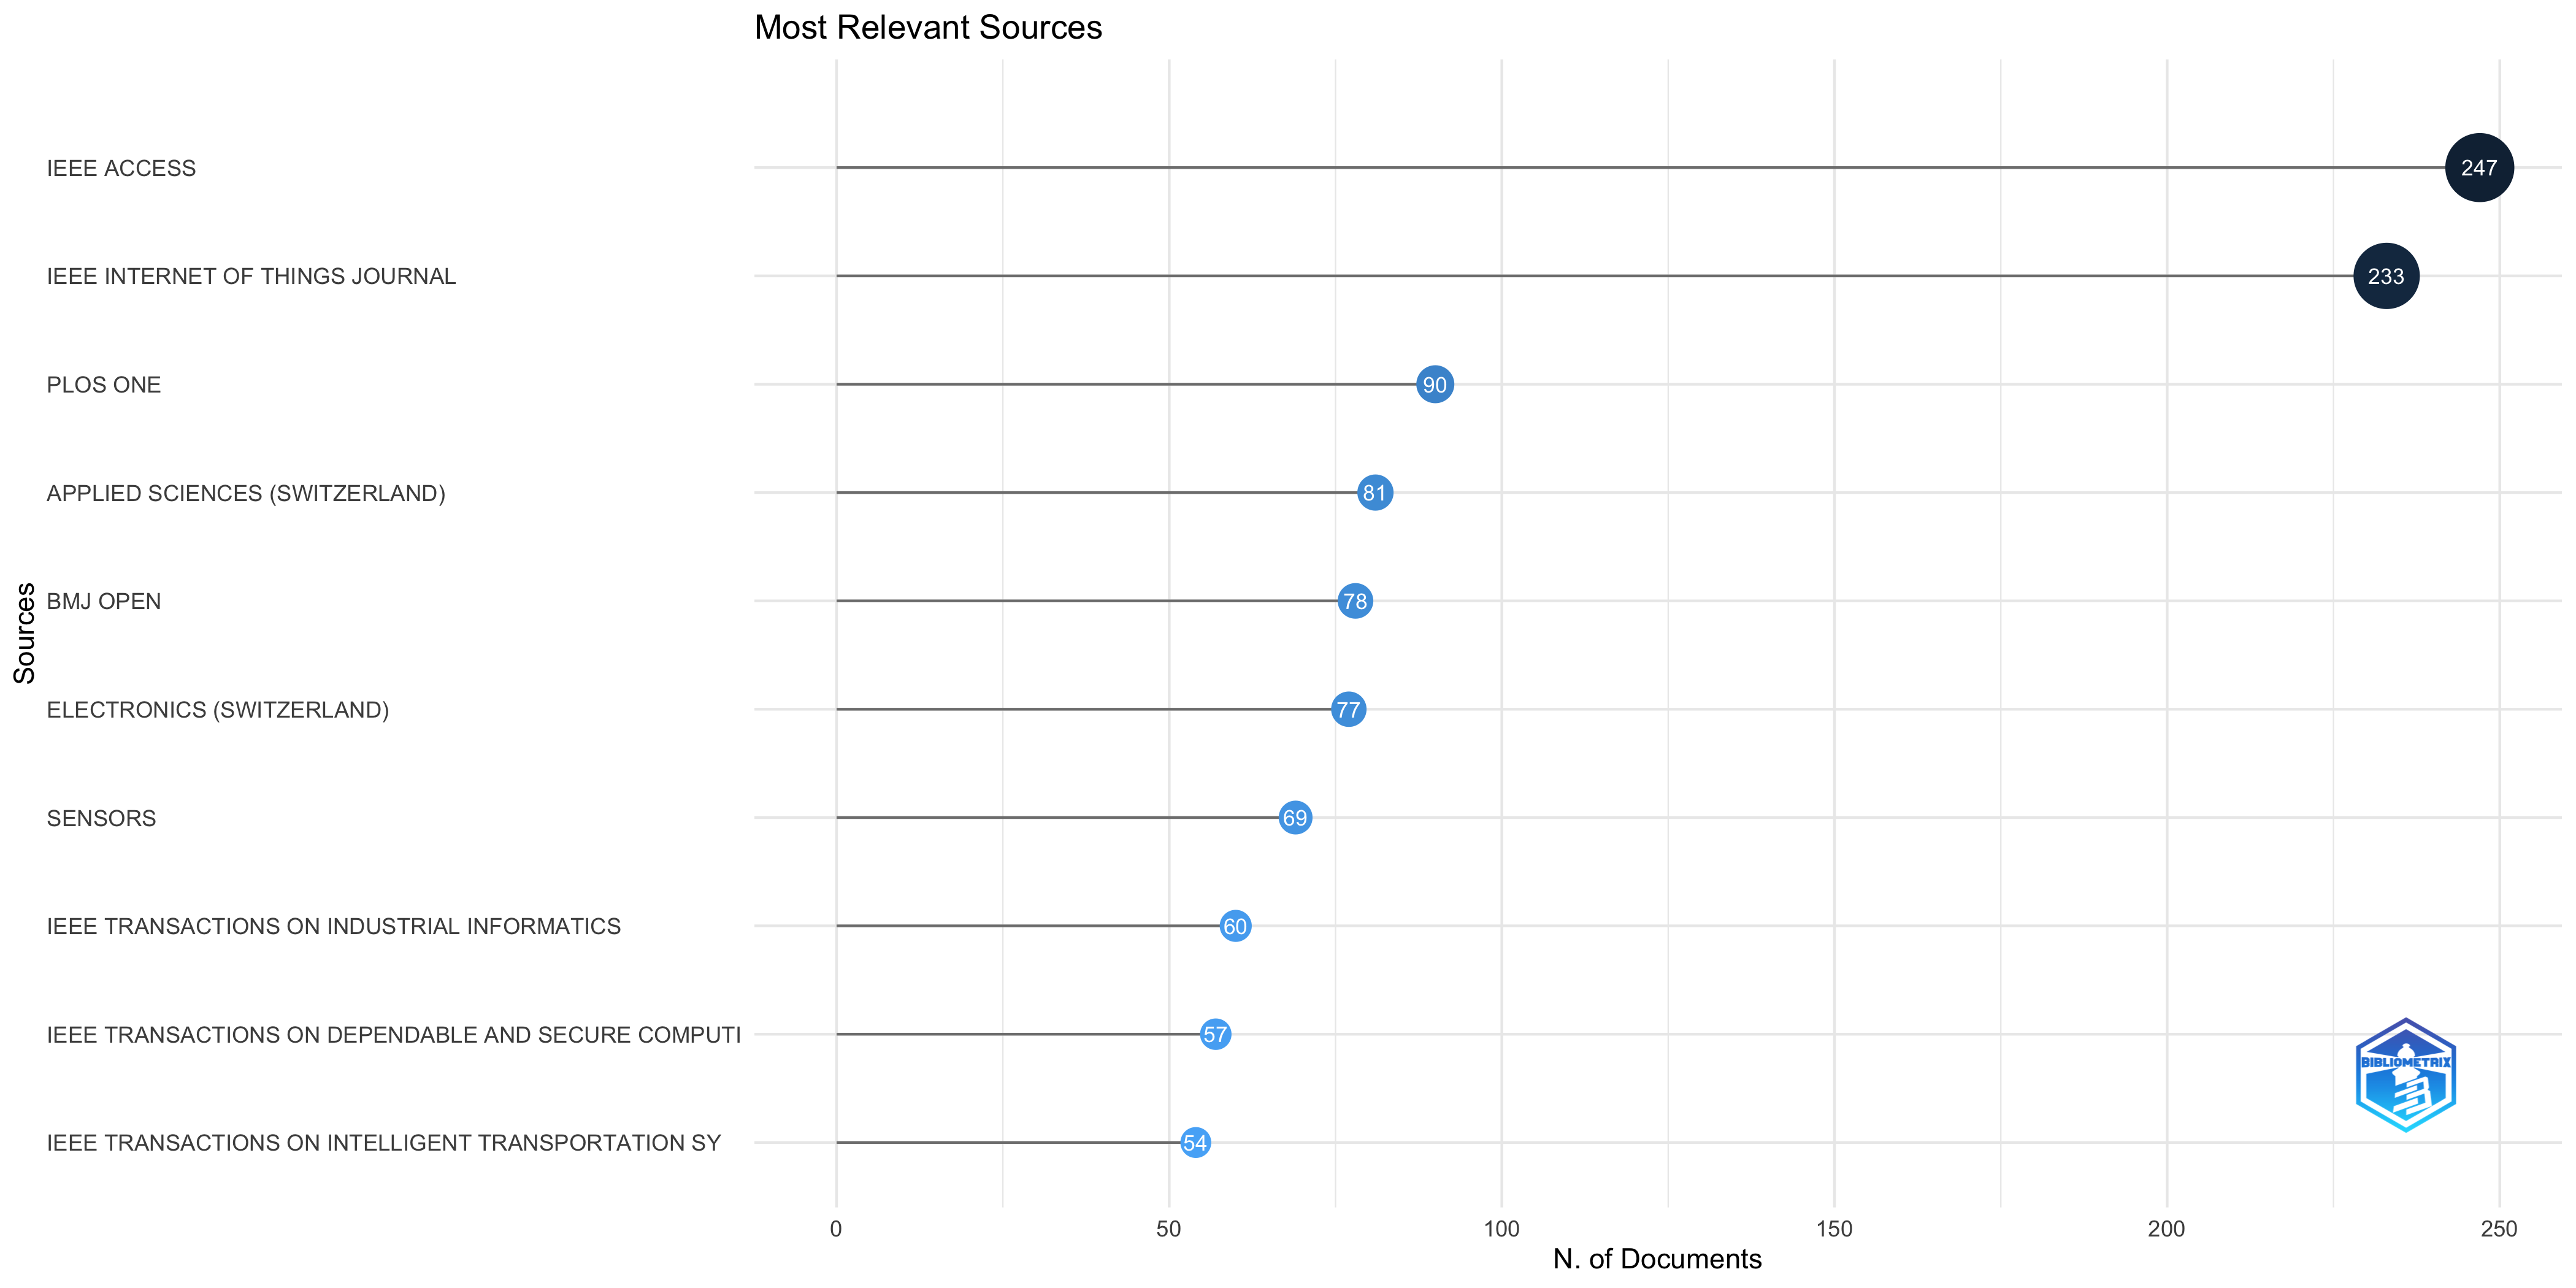
| IEEE ACCESS | 247 |
| IEEE INTERNET OF THINGS JOURNAL | 233 |
| PLOS ONE | 90 |
| APPLIED SCIENCES (SWITZERLAND) | 81 |
| BMJ OPEN | 78 |
| ELECTRONICS (SWITZERLAND) | 77 |
| SENSORS | 69 |
| IEEE TRANSACTIONS ON INDUSTRIAL INFORMATICS | 60 |
| IEEE TRANSACTIONS ON DEPENDABLE AND SECURE COMPUTING | 57 |
| IEEE TRANSACTIONS ON INTELLIGENT TRANSPORTATION SYSTEMS | 54 |
| PEER-TO-PEER NETWORKING AND APPLICATIONS | 54 |
| IEEE TRANSACTIONS ON VEHICULAR TECHNOLOGY | 52 |
| SUSTAINABILITY (SWITZERLAND) | 52 |
| SECURITY AND COMMUNICATION NETWORKS | 51 |
| IEEE TRANSACTIONS ON INFORMATION FORENSICS AND SECURITY | 50 |
| MULTIMEDIA TOOLS AND APPLICATIONS | 50 |
| SCIENTIFIC REPORTS | 50 |
| WIRELESS COMMUNICATIONS AND MOBILE COMPUTING | 48 |
| JOURNAL OF MEDICAL INTERNET RESEARCH | 47 |
| FUTURE GENERATION COMPUTER SYSTEMS | 45 |
| JOURNAL OF SYSTEMS ARCHITECTURE | 44 |
| INFORMATION SCIENCES | 42 |
| JOURNAL OF SUPERCOMPUTING | 41 |
| COMPUTERS, MATERIALS AND CONTINUA | 38 |
| IEEE TRANSACTIONS ON SERVICES COMPUTING | 37 |
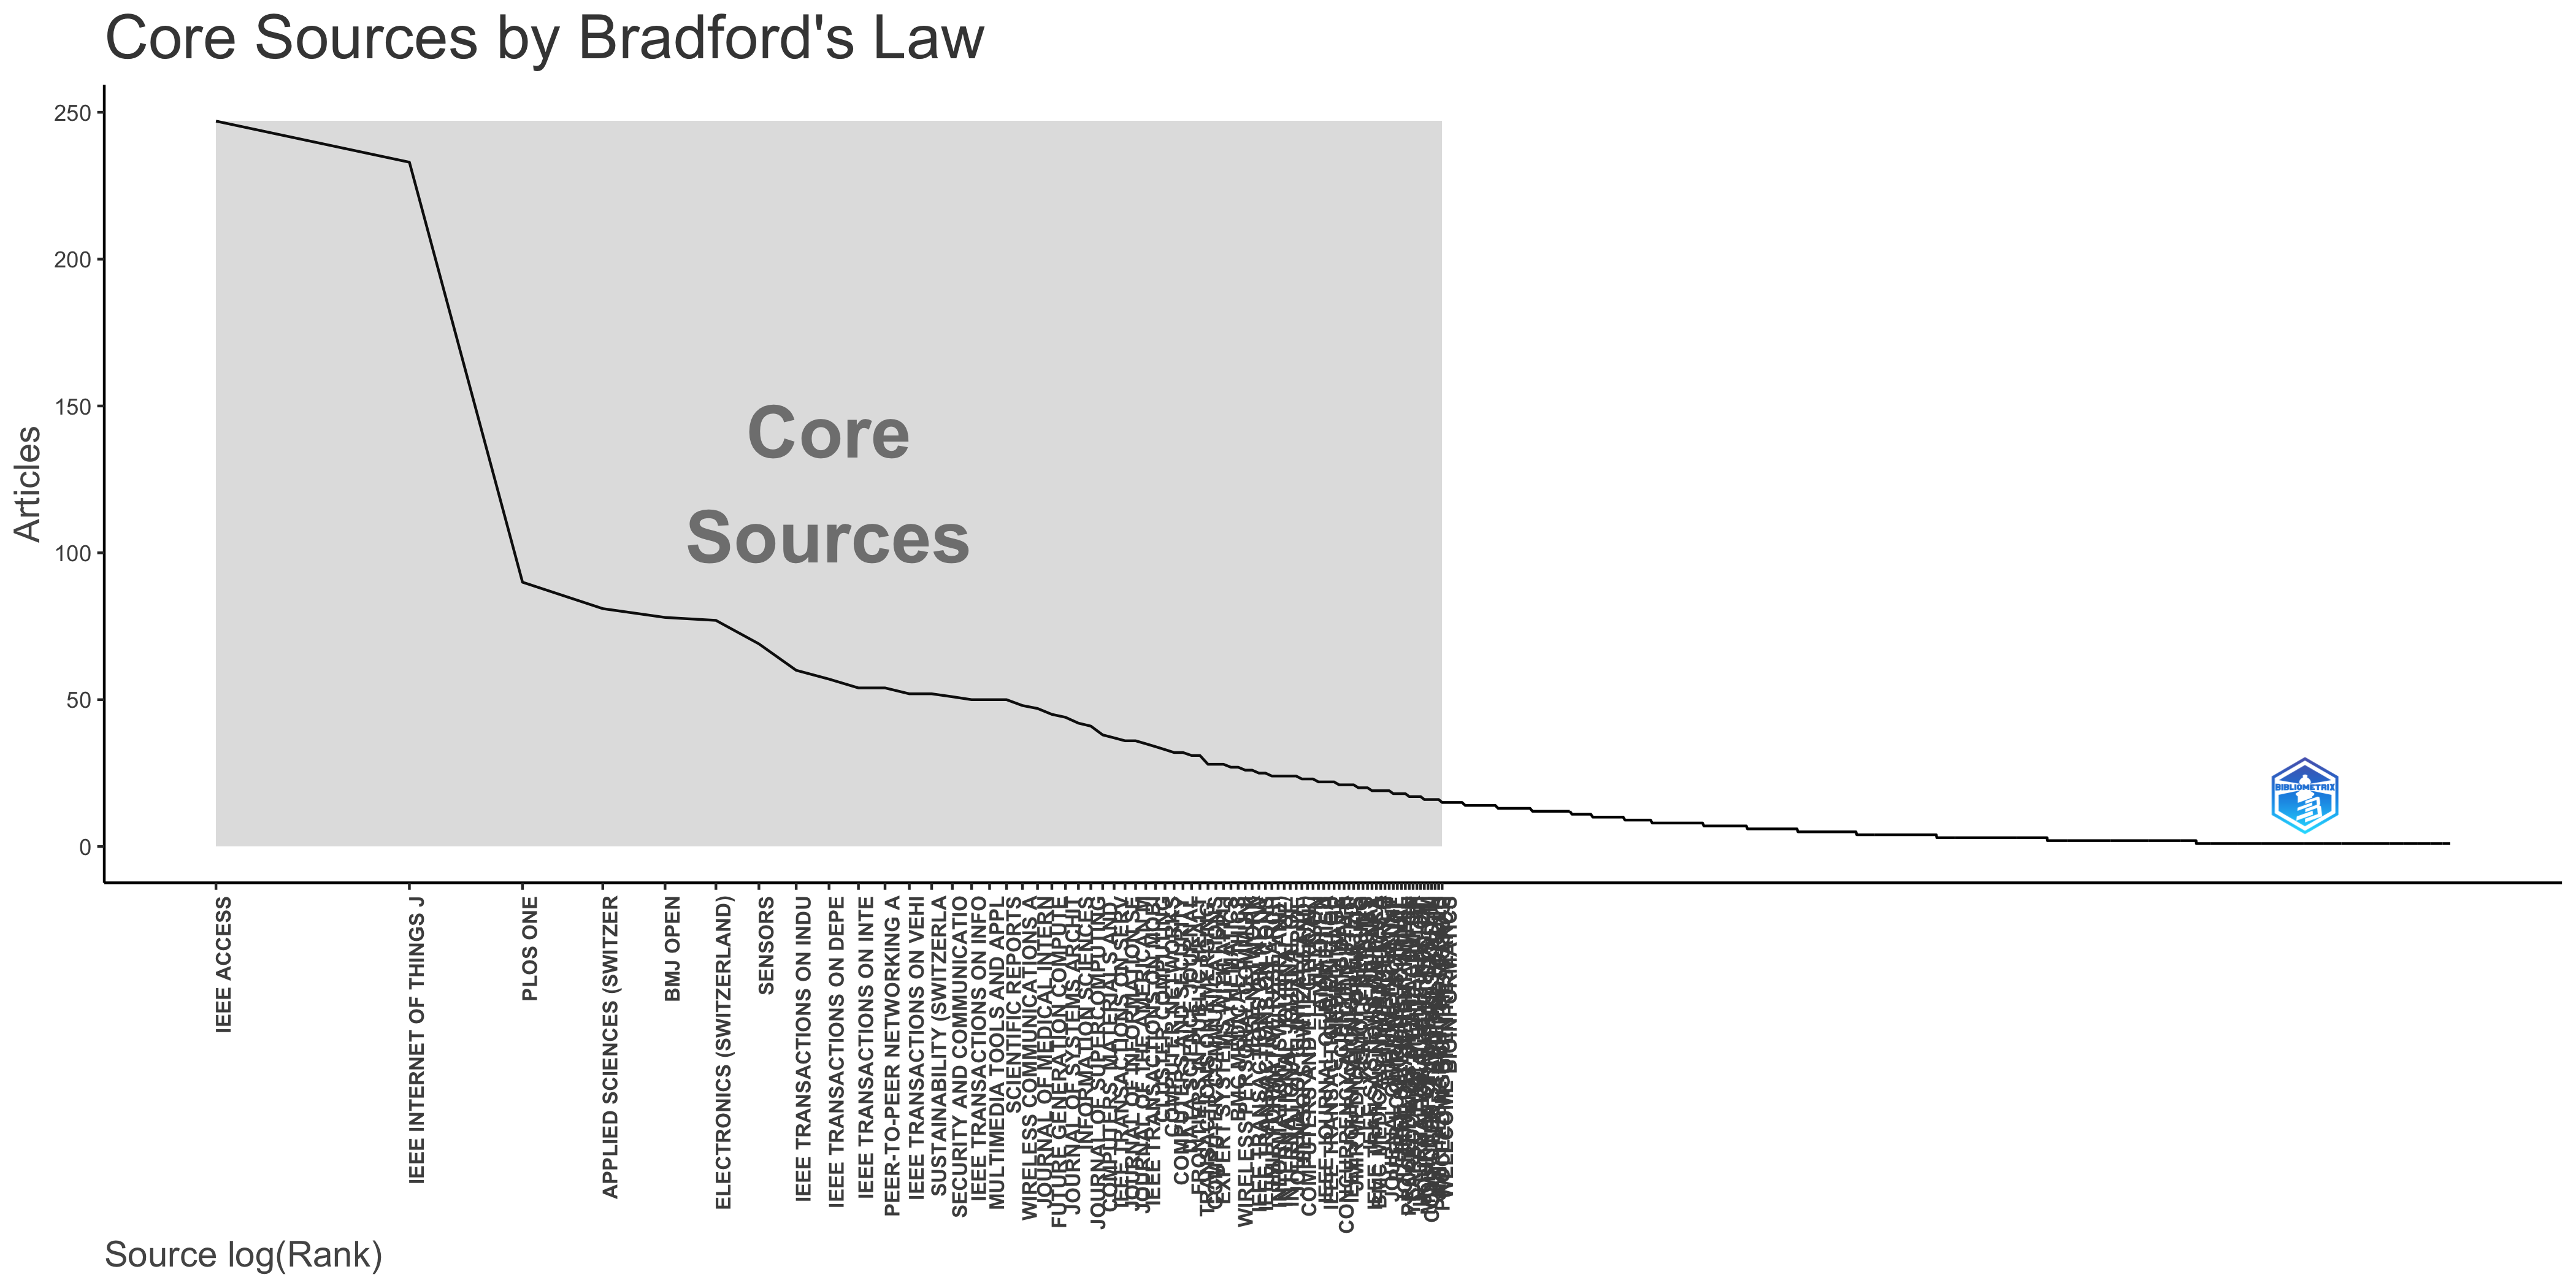
Core Sources by Bradford’s Law
| IEEE ACCESS | 1 | 247 | 247 | Zone 1 |
| IEEE INTERNET OF THINGS JOURNAL | 2 | 233 | 480 | Zone 1 |
| PLOS ONE | 3 | 90 | 570 | Zone 1 |
| APPLIED SCIENCES (SWITZERLAND) | 4 | 81 | 651 | Zone 1 |
| BMJ OPEN | 5 | 78 | 729 | Zone 1 |
| ELECTRONICS (SWITZERLAND) | 6 | 77 | 806 | Zone 1 |
| SENSORS | 7 | 69 | 875 | Zone 1 |
| IEEE TRANSACTIONS ON INDUSTRIAL INFORMATICS | 8 | 60 | 935 | Zone 1 |
| IEEE TRANSACTIONS ON DEPENDABLE AND SECURE COMPUTING | 9 | 57 | 992 | Zone 1 |
| IEEE TRANSACTIONS ON INTELLIGENT TRANSPORTATION SYSTEMS | 10 | 54 | 1046 | Zone 1 |
| PEER-TO-PEER NETWORKING AND APPLICATIONS | 11 | 54 | 1100 | Zone 1 |
| IEEE TRANSACTIONS ON VEHICULAR TECHNOLOGY | 12 | 52 | 1152 | Zone 1 |
| SUSTAINABILITY (SWITZERLAND) | 13 | 52 | 1204 | Zone 1 |
| SECURITY AND COMMUNICATION NETWORKS | 14 | 51 | 1255 | Zone 1 |
| IEEE TRANSACTIONS ON INFORMATION FORENSICS AND SECURITY | 15 | 50 | 1305 | Zone 1 |
| MULTIMEDIA TOOLS AND APPLICATIONS | 16 | 50 | 1355 | Zone 1 |
| SCIENTIFIC REPORTS | 17 | 50 | 1405 | Zone 1 |
| WIRELESS COMMUNICATIONS AND MOBILE COMPUTING | 18 | 48 | 1453 | Zone 1 |
| JOURNAL OF MEDICAL INTERNET RESEARCH | 19 | 47 | 1500 | Zone 1 |
| FUTURE GENERATION COMPUTER SYSTEMS | 20 | 45 | 1545 | Zone 1 |
| JOURNAL OF SYSTEMS ARCHITECTURE | 21 | 44 | 1589 | Zone 1 |
| INFORMATION SCIENCES | 22 | 42 | 1631 | Zone 1 |
| JOURNAL OF SUPERCOMPUTING | 23 | 41 | 1672 | Zone 1 |
| COMPUTERS, MATERIALS AND CONTINUA | 24 | 38 | 1710 | Zone 1 |
| IEEE TRANSACTIONS ON SERVICES COMPUTING | 25 | 37 | 1747 | Zone 1 |
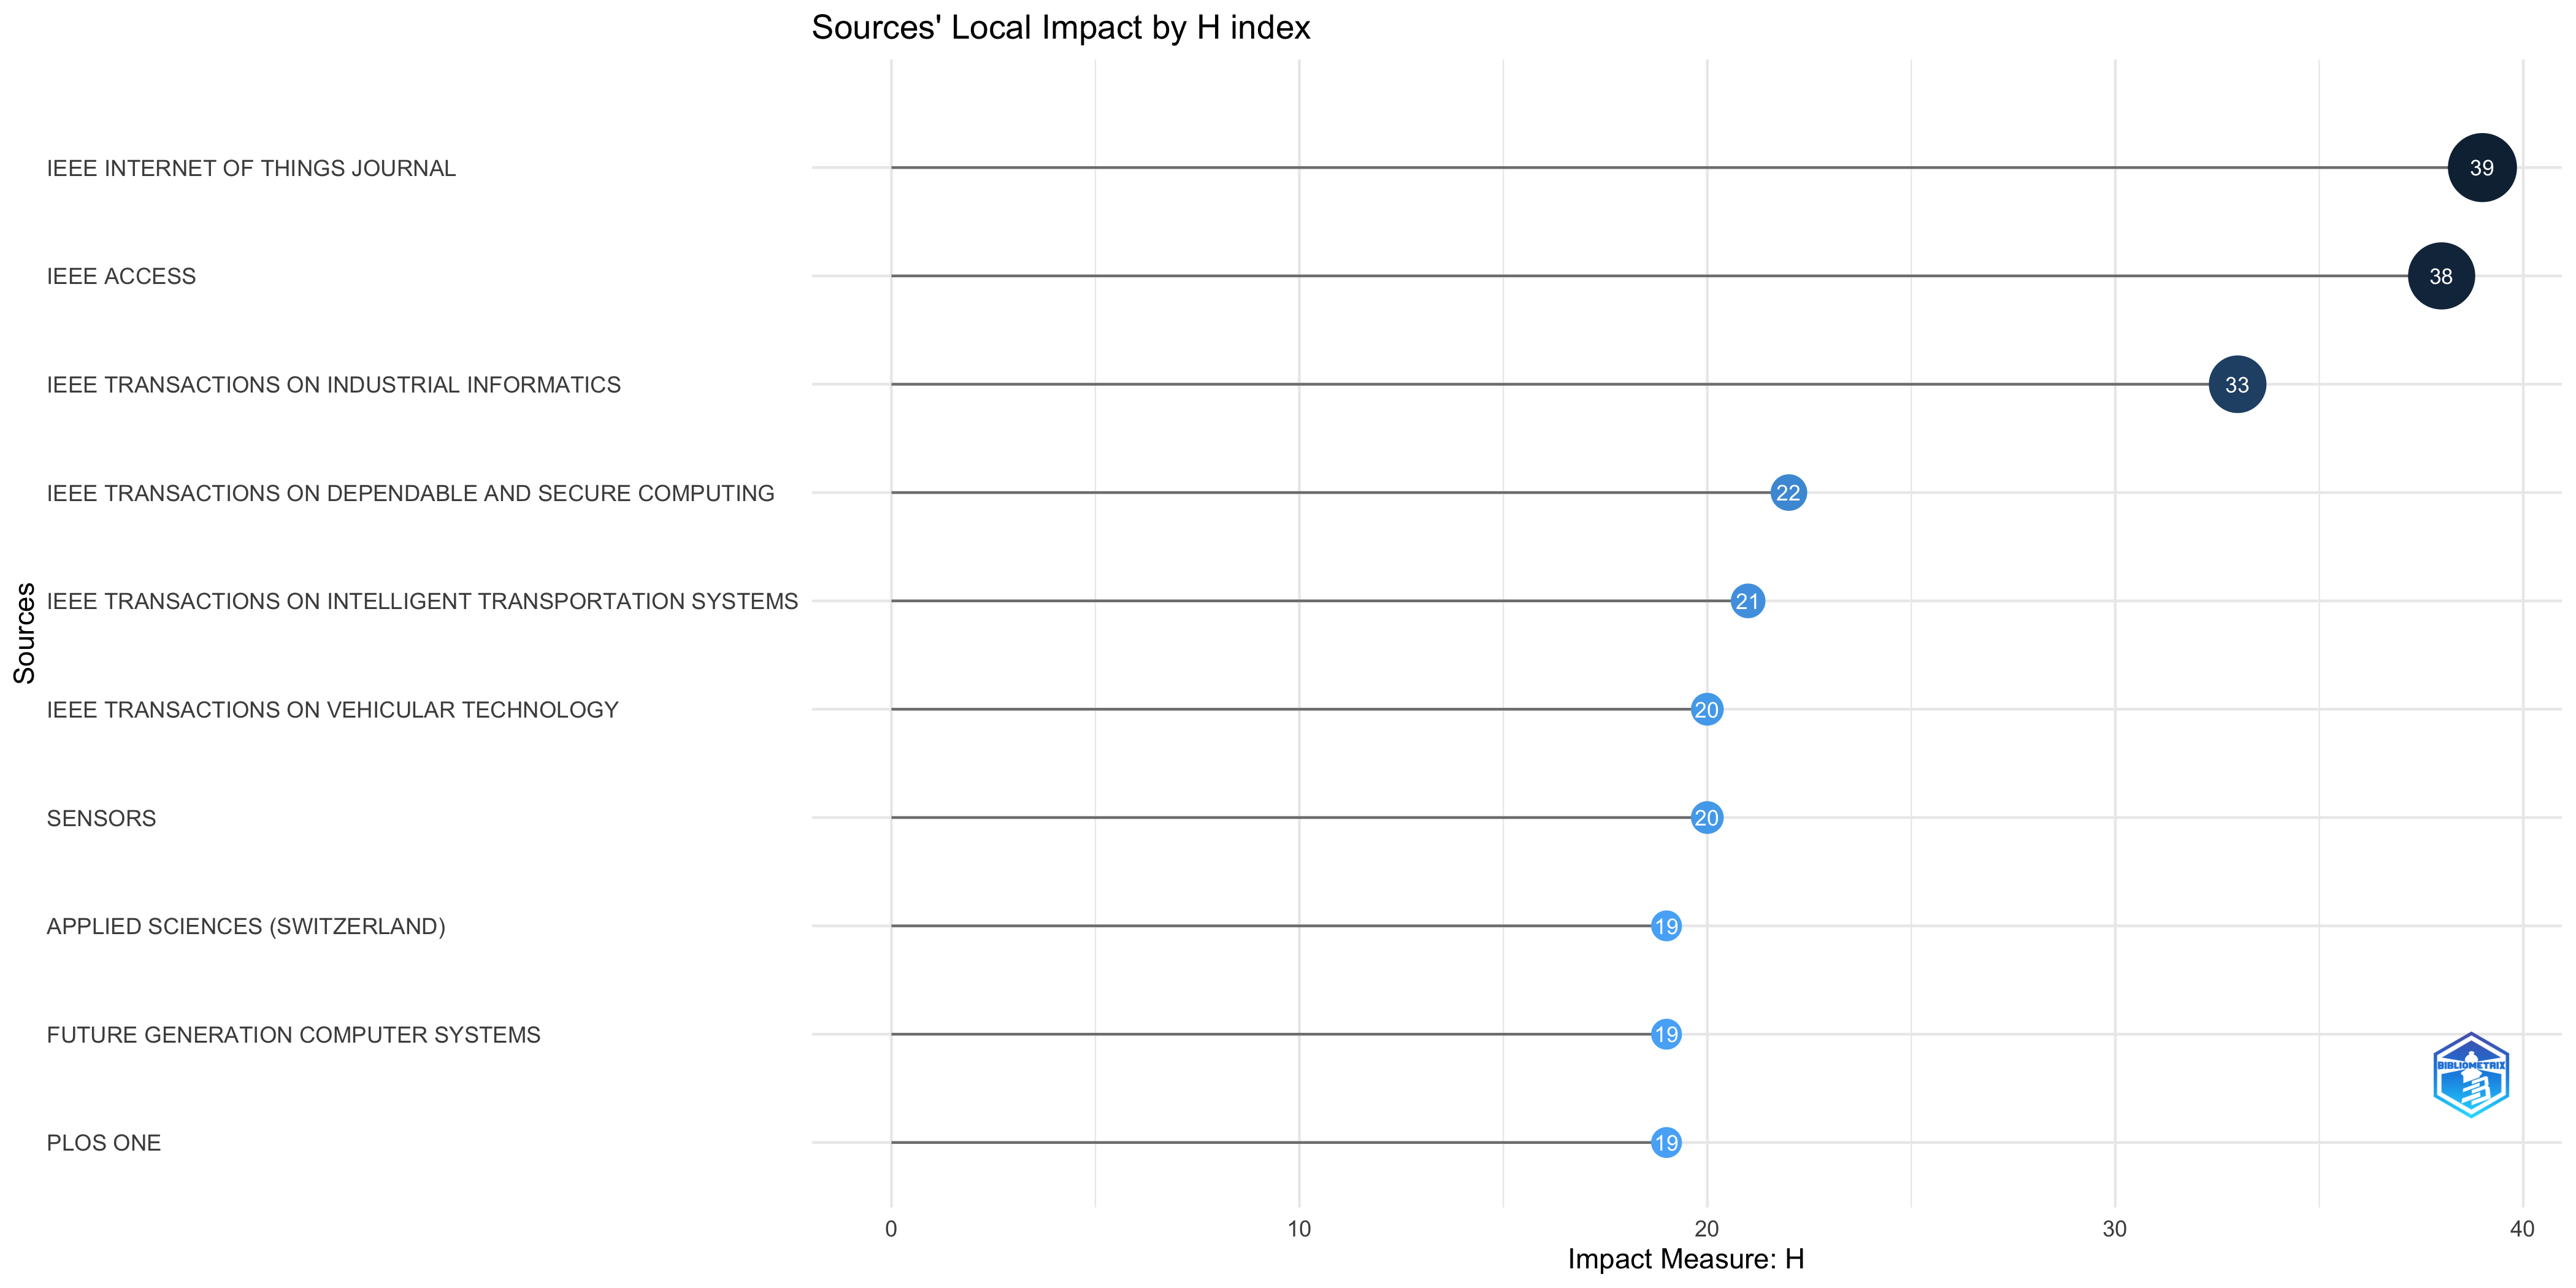
Sources’ Local Impact
| IEEE INTERNET OF THINGS JOURNAL | 39 | 67 | 6.500 | 5540 | 233 | 2020 |
| IEEE ACCESS | 38 | 58 | 6.333 | 4896 | 247 | 2020 |
| IEEE TRANSACTIONS ON INDUSTRIAL INFORMATICS | 33 | 60 | 5.500 | 4663 | 60 | 2020 |
| IEEE TRANSACTIONS ON DEPENDABLE AND SECURE COMPUTING | 22 | 46 | 3.667 | 2158 | 57 | 2020 |
| IEEE TRANSACTIONS ON INTELLIGENT TRANSPORTATION SYSTEMS | 21 | 37 | 4.200 | 1381 | 54 | 2021 |
| IEEE TRANSACTIONS ON VEHICULAR TECHNOLOGY | 20 | 46 | 3.333 | 2186 | 52 | 2020 |
| SENSORS | 20 | 31 | 4.000 | 1155 | 69 | 2021 |
| APPLIED SCIENCES (SWITZERLAND) | 19 | 32 | 3.167 | 1143 | 81 | 2020 |
| FUTURE GENERATION COMPUTER SYSTEMS | 19 | 33 | 3.167 | 1152 | 45 | 2020 |
| PLOS ONE | 19 | 31 | 3.167 | 1165 | 90 | 2020 |
| IEEE TRANSACTIONS ON INFORMATION FORENSICS AND SECURITY | 17 | 29 | 2.833 | 921 | 50 | 2020 |
| INFORMATION SCIENCES | 16 | 30 | 2.667 | 980 | 42 | 2020 |
| ELECTRONICS (SWITZERLAND) | 15 | 31 | 2.500 | 1059 | 77 | 2020 |
| IEEE NETWORK | 15 | 26 | 2.500 | 1604 | 26 | 2020 |
| SENSORS (SWITZERLAND) | 15 | 24 | 2.500 | 886 | 24 | 2020 |
| SUSTAINABILITY (SWITZERLAND) | 15 | 30 | 2.500 | 1019 | 52 | 2020 |
| IEEE TRANSACTIONS ON NETWORK SCIENCE AND ENGINEERING | 14 | 26 | 2.333 | 1089 | 26 | 2020 |
| MULTIMEDIA TOOLS AND APPLICATIONS | 14 | 24 | 2.333 | 661 | 50 | 2020 |
| NEUROIMAGE | 14 | 22 | 2.333 | 566 | 22 | 2020 |
| IEEE JOURNAL ON SELECTED AREAS IN COMMUNICATIONS | 13 | 21 | 2.167 | 1271 | 21 | 2020 |
| JOURNAL OF INFORMATION SECURITY AND APPLICATIONS | 13 | 20 | 2.167 | 449 | 36 | 2020 |
| JOURNAL OF MEDICAL INTERNET RESEARCH | 13 | 25 | 2.167 | 688 | 47 | 2020 |
| JOURNAL OF SYSTEMS ARCHITECTURE | 13 | 25 | 2.167 | 692 | 44 | 2020 |
| BMC MEDICAL ETHICS | 12 | 17 | 2.000 | 326 | 27 | 2020 |
| COMPUTERS AND SECURITY | 12 | 29 | 2.000 | 878 | 32 | 2020 |
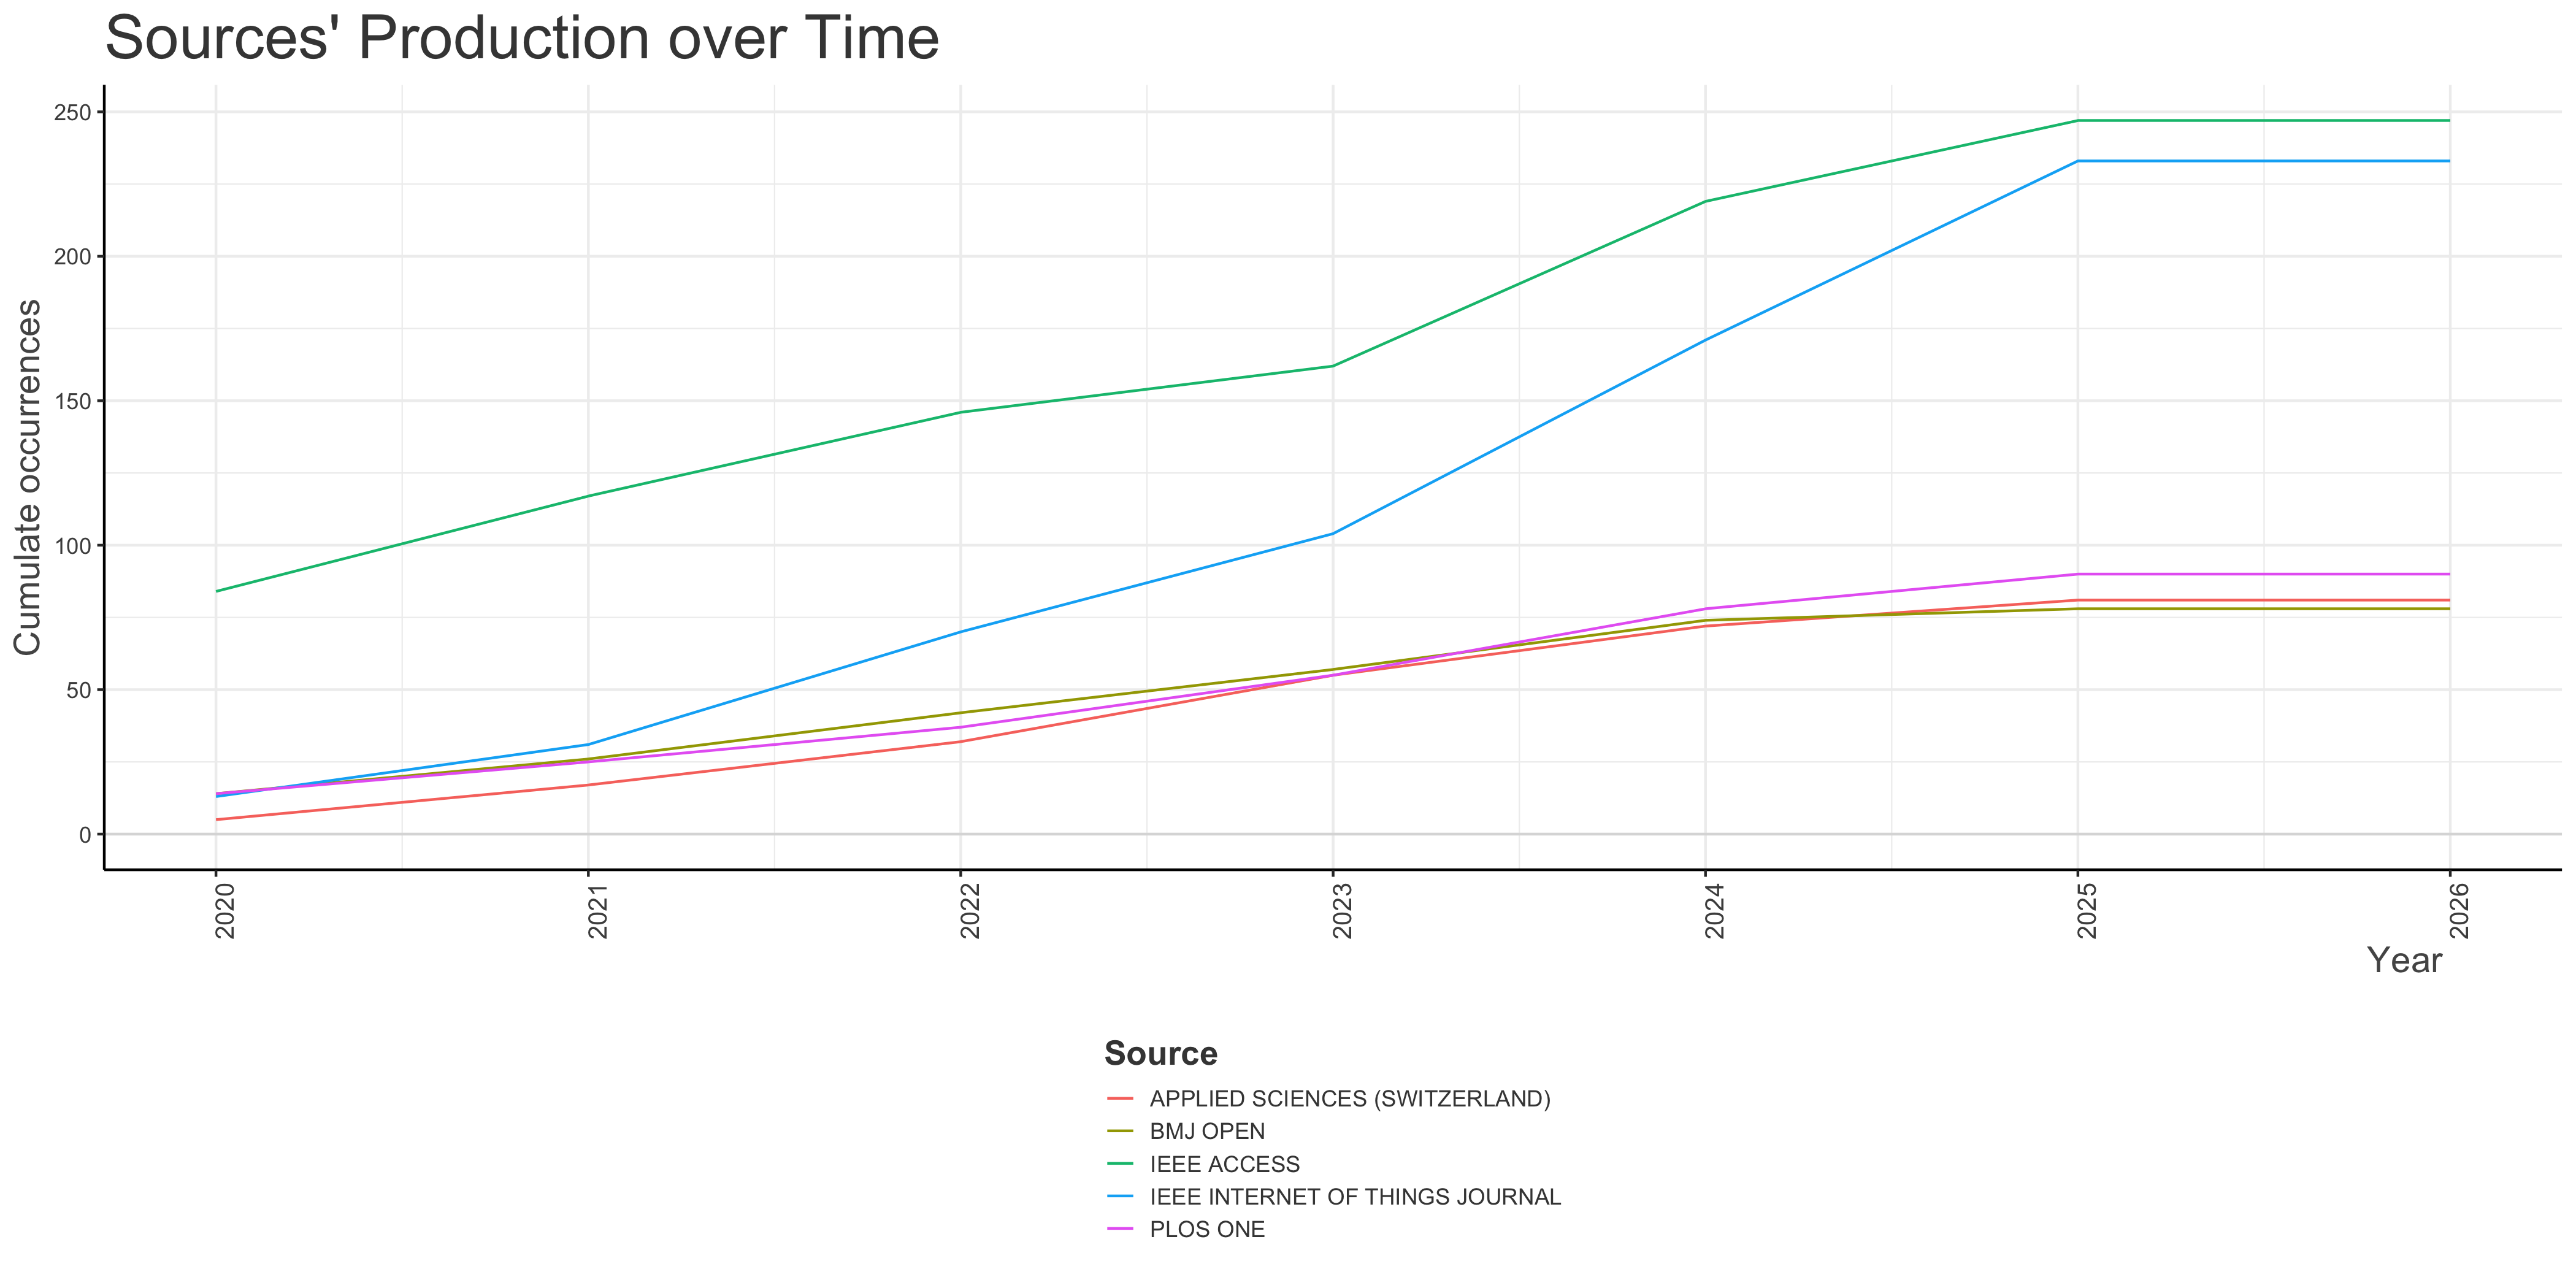
Sources’ Production over Time
Most Relevant Authors
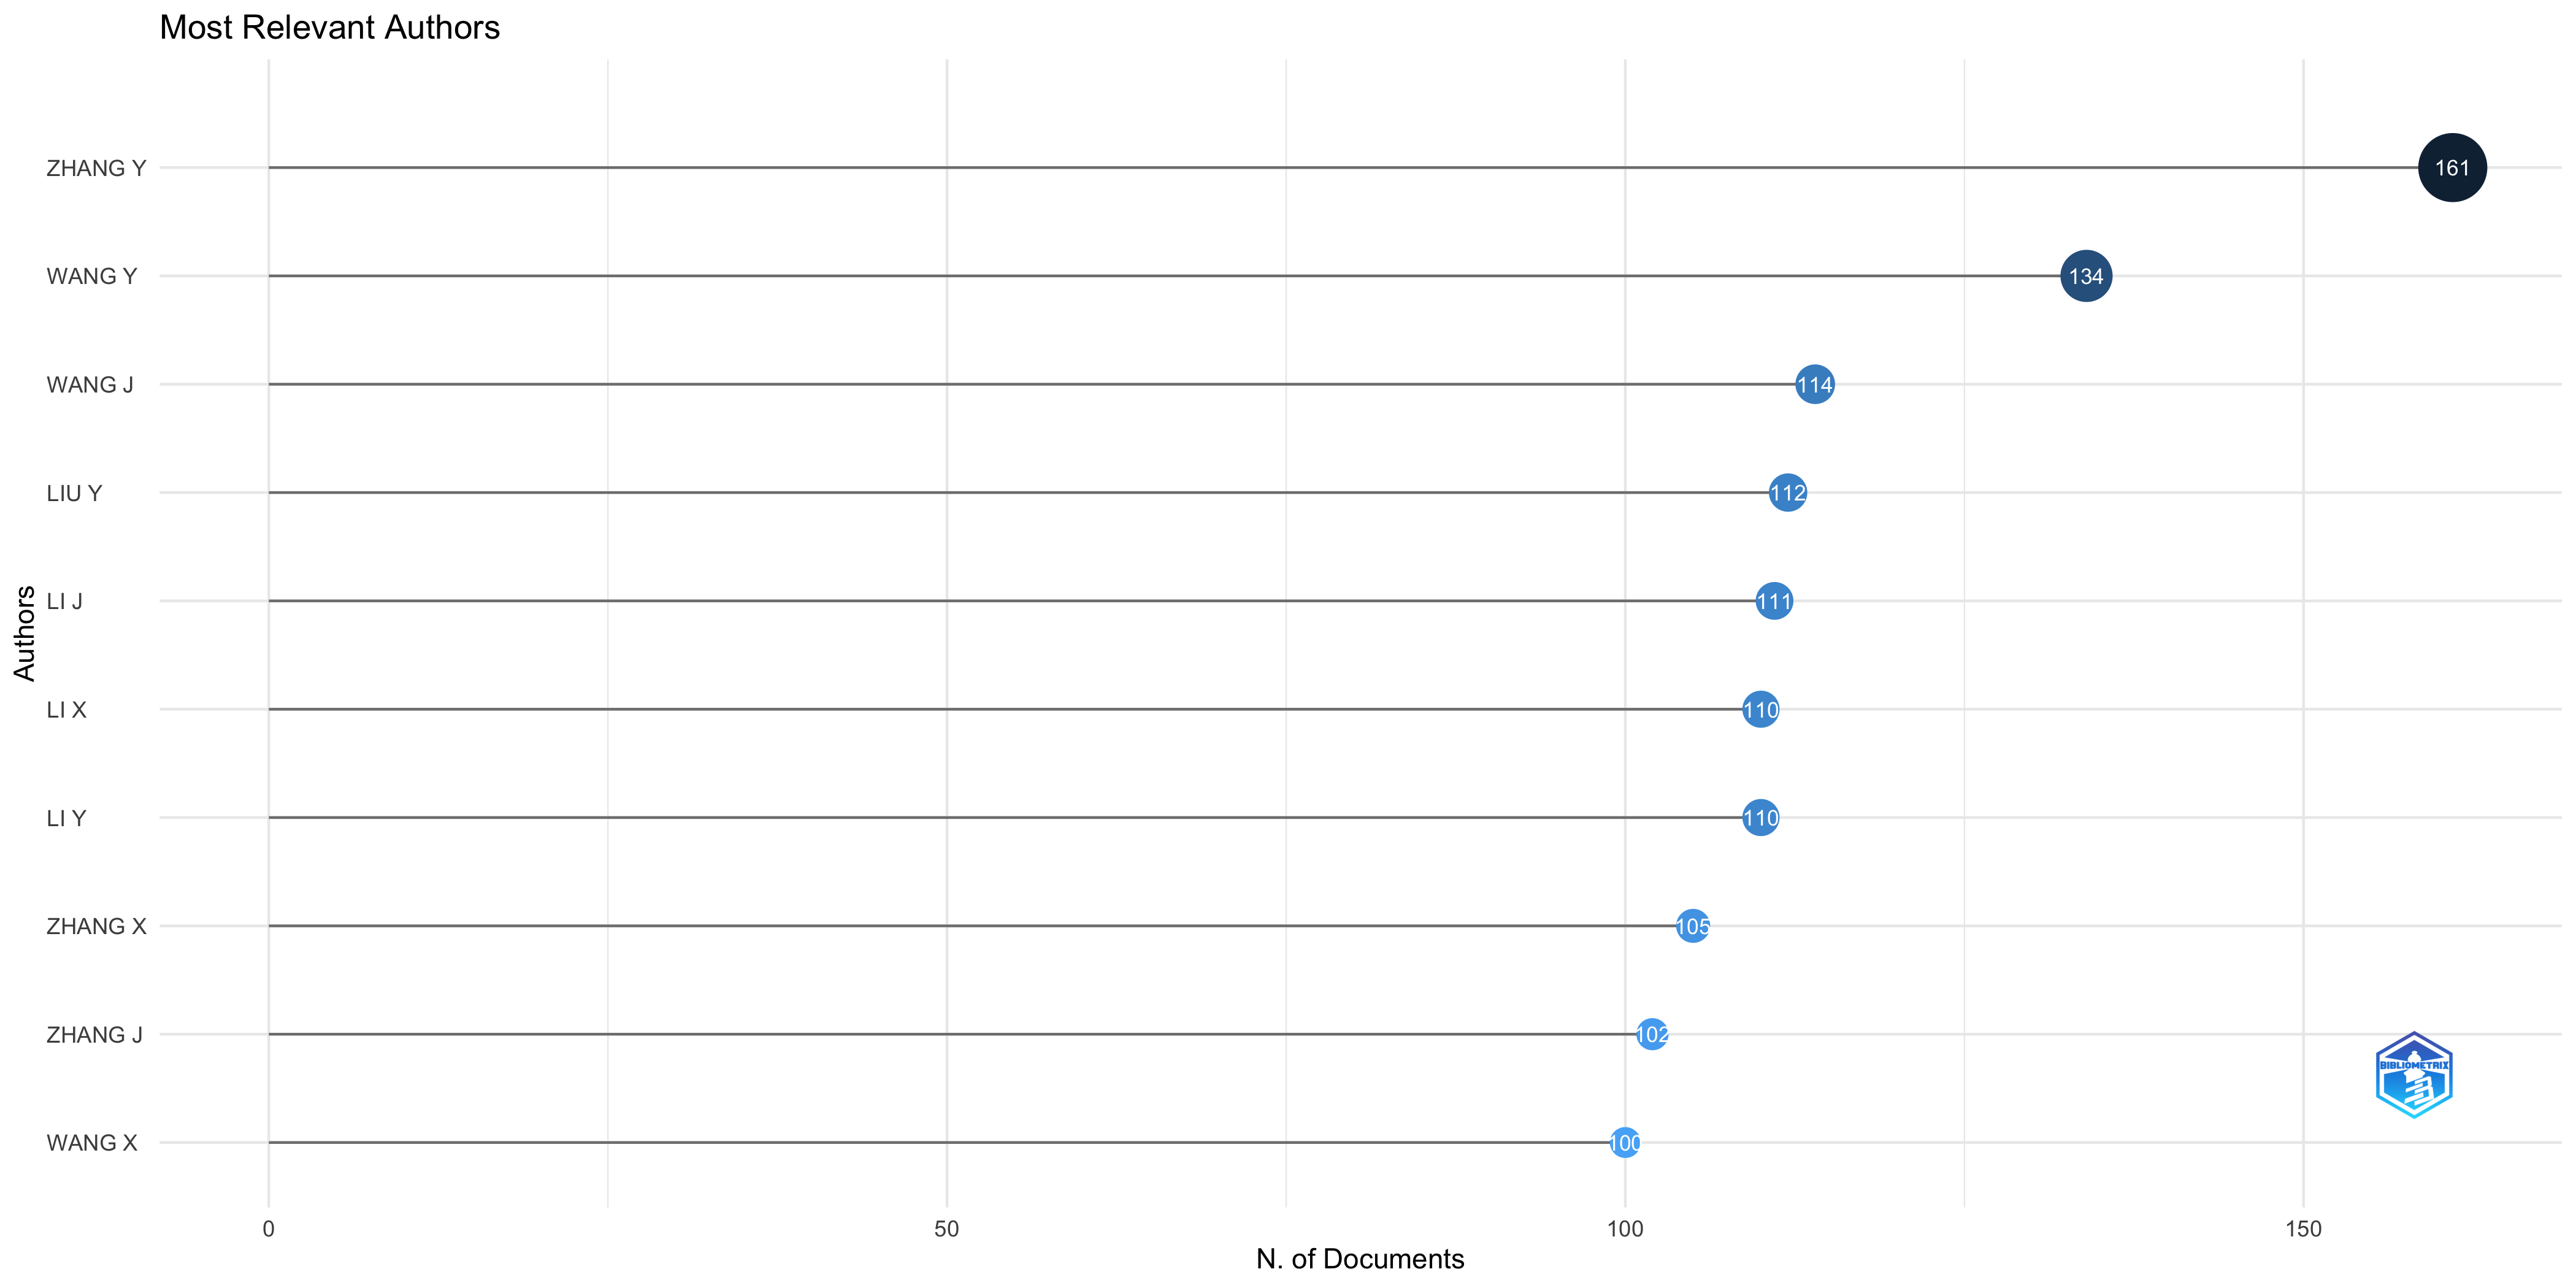
| ZHANG Y | 161 | 29.94 |
| WANG Y | 134 | 25.85 |
| WANG J | 114 | 22.78 |
| LIU Y | 112 | 20.41 |
| LI J | 111 | 20.83 |
| LI X | 110 | 19.64 |
| LI Y | 110 | 19.67 |
| ZHANG X | 105 | 20.47 |
| ZHANG J | 102 | 18.38 |
| WANG X | 100 | 21.27 |
| WANG H | 97 | 18.62 |
| LIU X | 88 | 18.46 |
| CHEN Y | 87 | 16.01 |
| ZHANG L | 87 | 17.99 |
| WANG C | 79 | 16.53 |
| WANG Z | 79 | 16.41 |
| LIU J | 77 | 12.93 |
| CHEN J | 72 | 14.78 |
| ZHANG Z | 71 | 13.42 |
| LI H | 70 | 14.11 |
| LI Z | 67 | 12.62 |
| WANG S | 66 | 11.69 |
| LIU Z | 62 | 10.71 |
| LI C | 61 | 10.62 |
| WANG L | 57 | 11.79 |
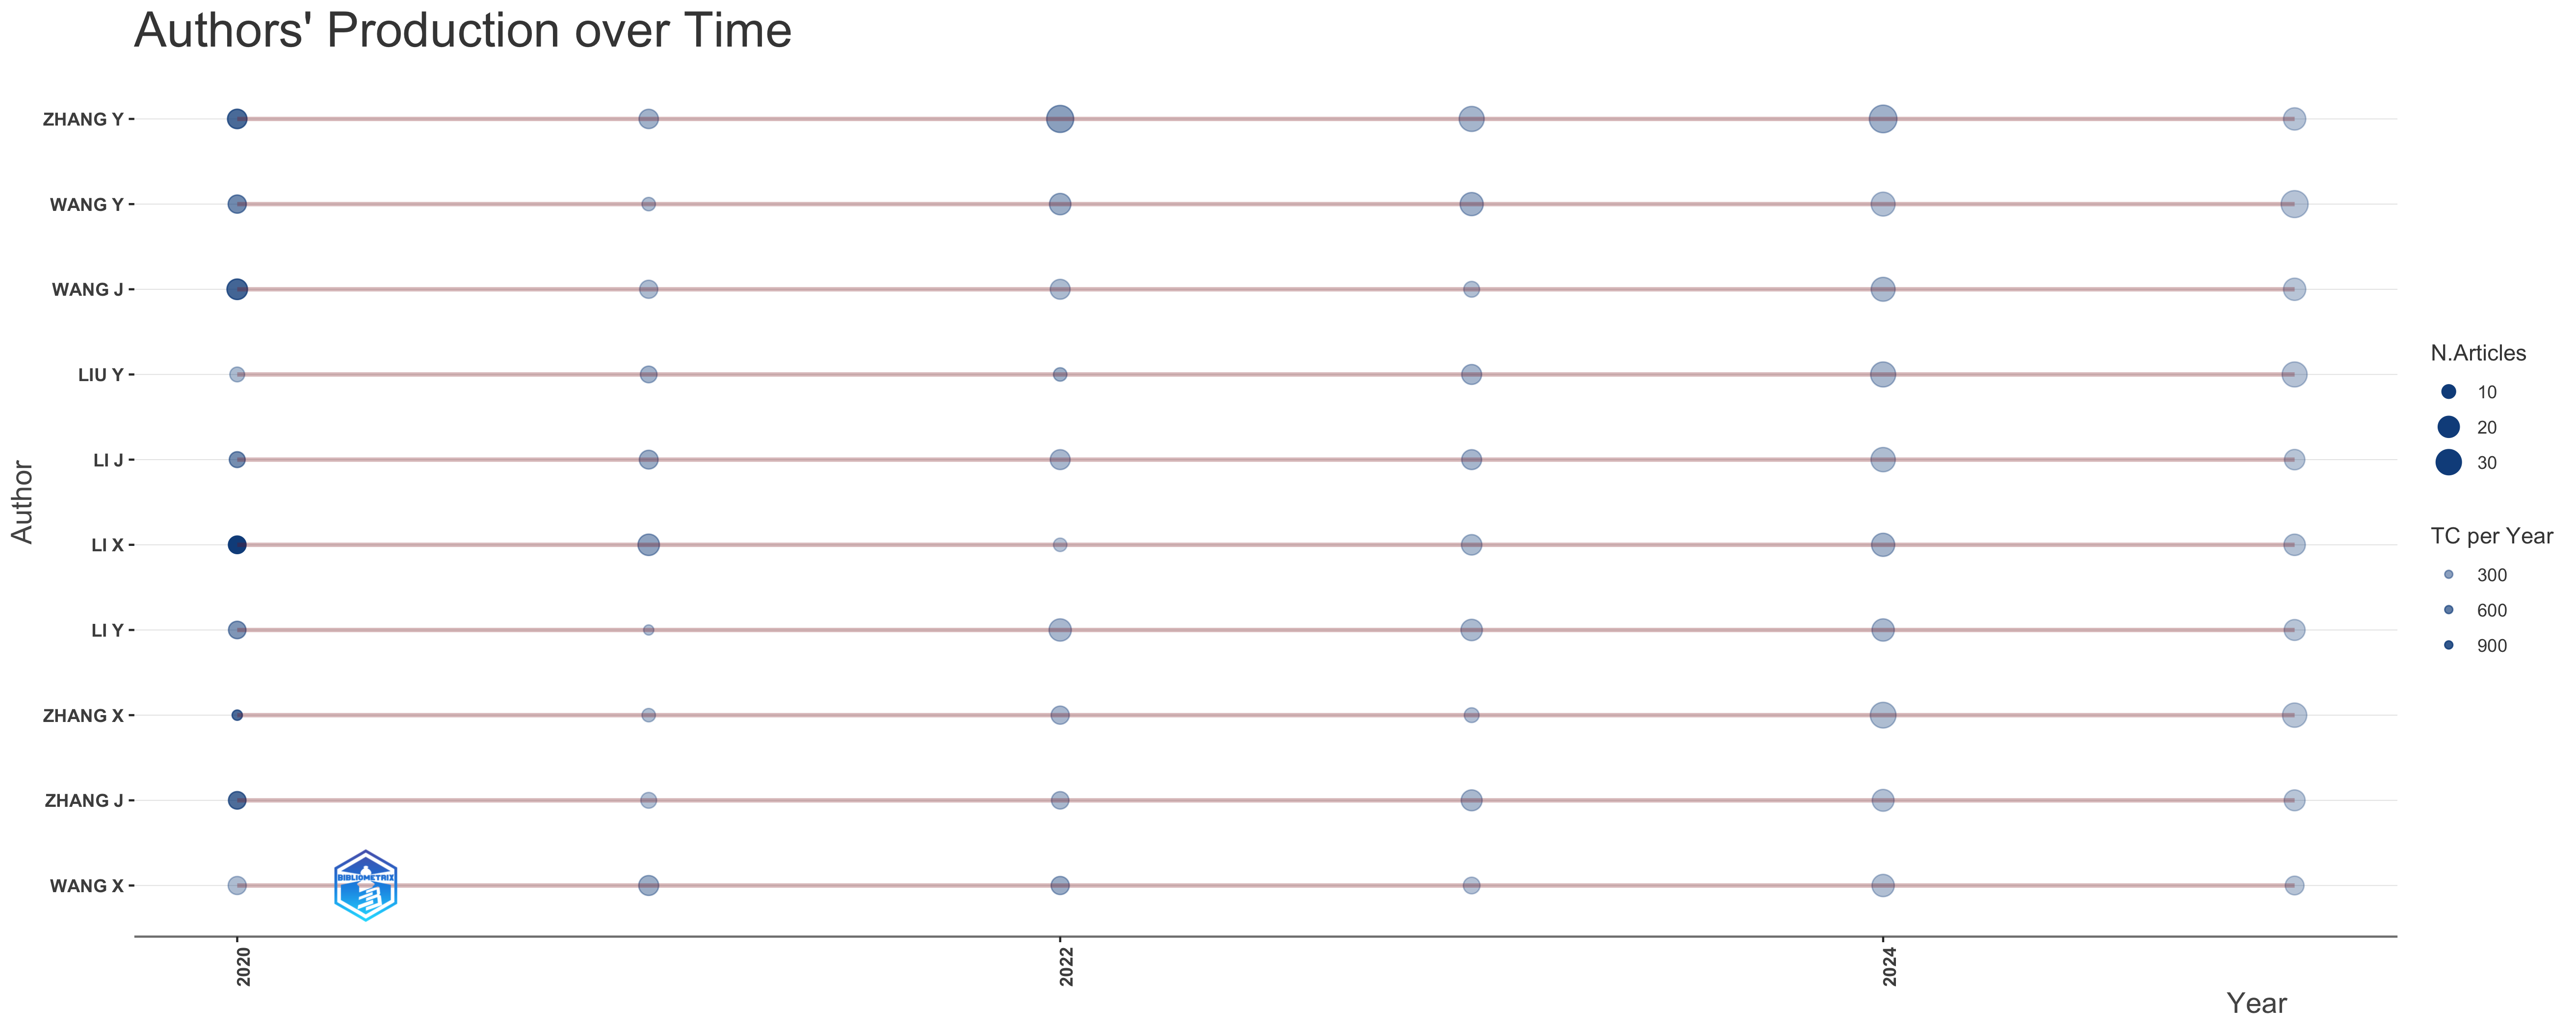
Overall Observations:
- Time Span: The plot covers a relatively short period, from 2020 to 2024. This suggests the research field may be relatively new or undergoing rapid development.
- Consistent Authorship: All the listed authors have publications in both the initial and final years of the analysis, showing consistent engagement within the field over this time.
- Bubble Size and Color: Recall that bubble size indicates the *number of articles* published in a given year, and color intensity reflects *total citations per year (TC/year)*.
Individual Author Analysis:
Here’s a breakdown by author, considering their productivity, impact (as measured by TC/year), and any notable trends:
- LI J: Shows sustained output, with modest number of publications each year, and stable citations. The most cited article, “PAN-CANCER ANALYSIS OF WHOLE GENOMES” (2020), is co-authored, but other works focus on federated learning and privacy in edge computing.
- LI X: Shows sustained output, with modest number of publications each year, and stable citations. The most cited article, “PAN-CANCER ANALYSIS OF WHOLE GENOMES” (2020), is co-authored.
- LI Y: This author also shows sustained productivity. A 2024 paper, “STOMICSDB: A COMPREHENSIVE DATABASE FOR SPATIAL TRANSCRIPTOMICS DATA SHARING, ANALYSIS AND VISUALIZATION,” is noteworthy as the most recent of the top-cited articles, suggesting potential for future impact.
- LIU Y: Shows sustained output, with modest number of publications each year, and stable citations. “IPROX IN 2021: CONNECTING PROTEOMICS DATA SHARING WITH BIG DATA” (2022) is their top-cited work, indicating influence in proteomics data sharing.
- WANG J: Similar to the ‘LI’ authors, Wang J. has consistent output across the years. Their top-cited article “PAN-CANCER ANALYSIS OF WHOLE GENOMES” (2020) is a co-authored, high-impact publication, along with a 2024 publication, “STOMICSDB: A COMPREHENSIVE DATABASE FOR SPATIAL TRANSCRIPTOMICS DATA SHARING, ANALYSIS AND VISUALIZATION”, which is also most recent of the top-cited articles, suggesting potential for future impact.
- WANG X: Maintains consistent productivity across the period, with similar number of publications and citations per year. Their work “IPROX IN 2021: CONNECTING PROTEOMICS DATA SHARING WITH BIG DATA” (2022) suggests a focus on image analysis and blockchain applications.
- WANG Y: Shows sustained output, with modest number of publications each year, and stable citations. Their work is related to dementia and federated learning for smart grids.
- ZHANG J: This author also shows sustained productivity. Their most-cited article is the “PAN-CANCER ANALYSIS OF WHOLE GENOMES” (2020), which is co-authored.
- ZHANG X: This author also shows sustained productivity. Their most-cited article is the “PAN-CANCER ANALYSIS OF WHOLE GENOMES” (2020), which is co-authored.
- ZHANG Y: This author also shows sustained productivity. The most cited work “BLOCKCHAIN AND FEDERATED LEARNING FOR PRIVACY-PRESERVED DATA SHARING IN INDUSTRIAL IOT” (2020) focuses on blockchain and federated learning in Industrial IoT.
Key Observations and Potential Interpretations:
- “PAN-CANCER ANALYSIS OF WHOLE GENOMES” is a Landmark Paper: The frequent appearance of “PAN-CANCER ANALYSIS OF WHOLE GENOMES” (2020) as the most-cited article for multiple authors (LI J, LI X, LI Y, WANG J, WANG Y, ZHANG J, ZHANG X, ZHANG Y) strongly suggests that this publication is a foundational or highly influential work in the field. This indicates that the authors likely collaborated on the same research project.
- Emerging Trends: Several authors (LI J, LIU Y, WANG X, WANG Y, ZHANG Y) have high-impact publications related to federated learning and blockchain. This suggests that these technologies are becoming increasingly important within this field. The presence of articles related to spatial transcriptomics (LI Y, WANG J) indicates another emerging area of interest.
- Data Sharing and Resources: The high citation rates for “IPROX IN 2021: CONNECTING PROTEOMICS DATA SHARING WITH BIG DATA” (LIU Y, WANG X) and “STOMICSDB: A COMPREHENSIVE DATABASE FOR SPATIAL TRANSCRIPTOMICS DATA SHARING, ANALYSIS AND VISUALIZATION” (LI Y, WANG J) point to the importance of data sharing and the development of comprehensive databases in this research area.
Suggestions for Further Investigation:
- Examine the content of the “PAN-CANCER ANALYSIS OF WHOLE GENOMES” paper: Understand its significance and why it’s so highly cited. Investigate its impact on subsequent research.
- Explore the specific applications of federated learning and blockchain: Determine the problems they are addressing within this research domain and assess their potential.
- Analyze the trends in spatial transcriptomics: Investigate the research questions being addressed using this technology and identify its potential for future discoveries.
- Collaboration Networks: The co-occurrence of the same highly cited paper across multiple authors suggests potential collaboration networks. A co-authorship analysis could reveal these connections.
- Journal Analysis: Note the journals where these authors are publishing. This can indicate the core journals in this research area.
Important Considerations:
- TC/year is a time-sensitive metric: Newer papers will naturally have lower TC/year values simply because they haven’t had as much time to accumulate citations.
- Context is Key: Always interpret bibliometric data within the context of the research field. Citation patterns and publication norms can vary significantly across disciplines.
- Database Limitations: The analysis is based on SCOPUS data. Results might differ if a different database (e.g., Web of Science) were used.
By considering these points, you can develop a more nuanced and insightful understanding of the research landscape represented in the “Authors’ Production Over Time” plot.
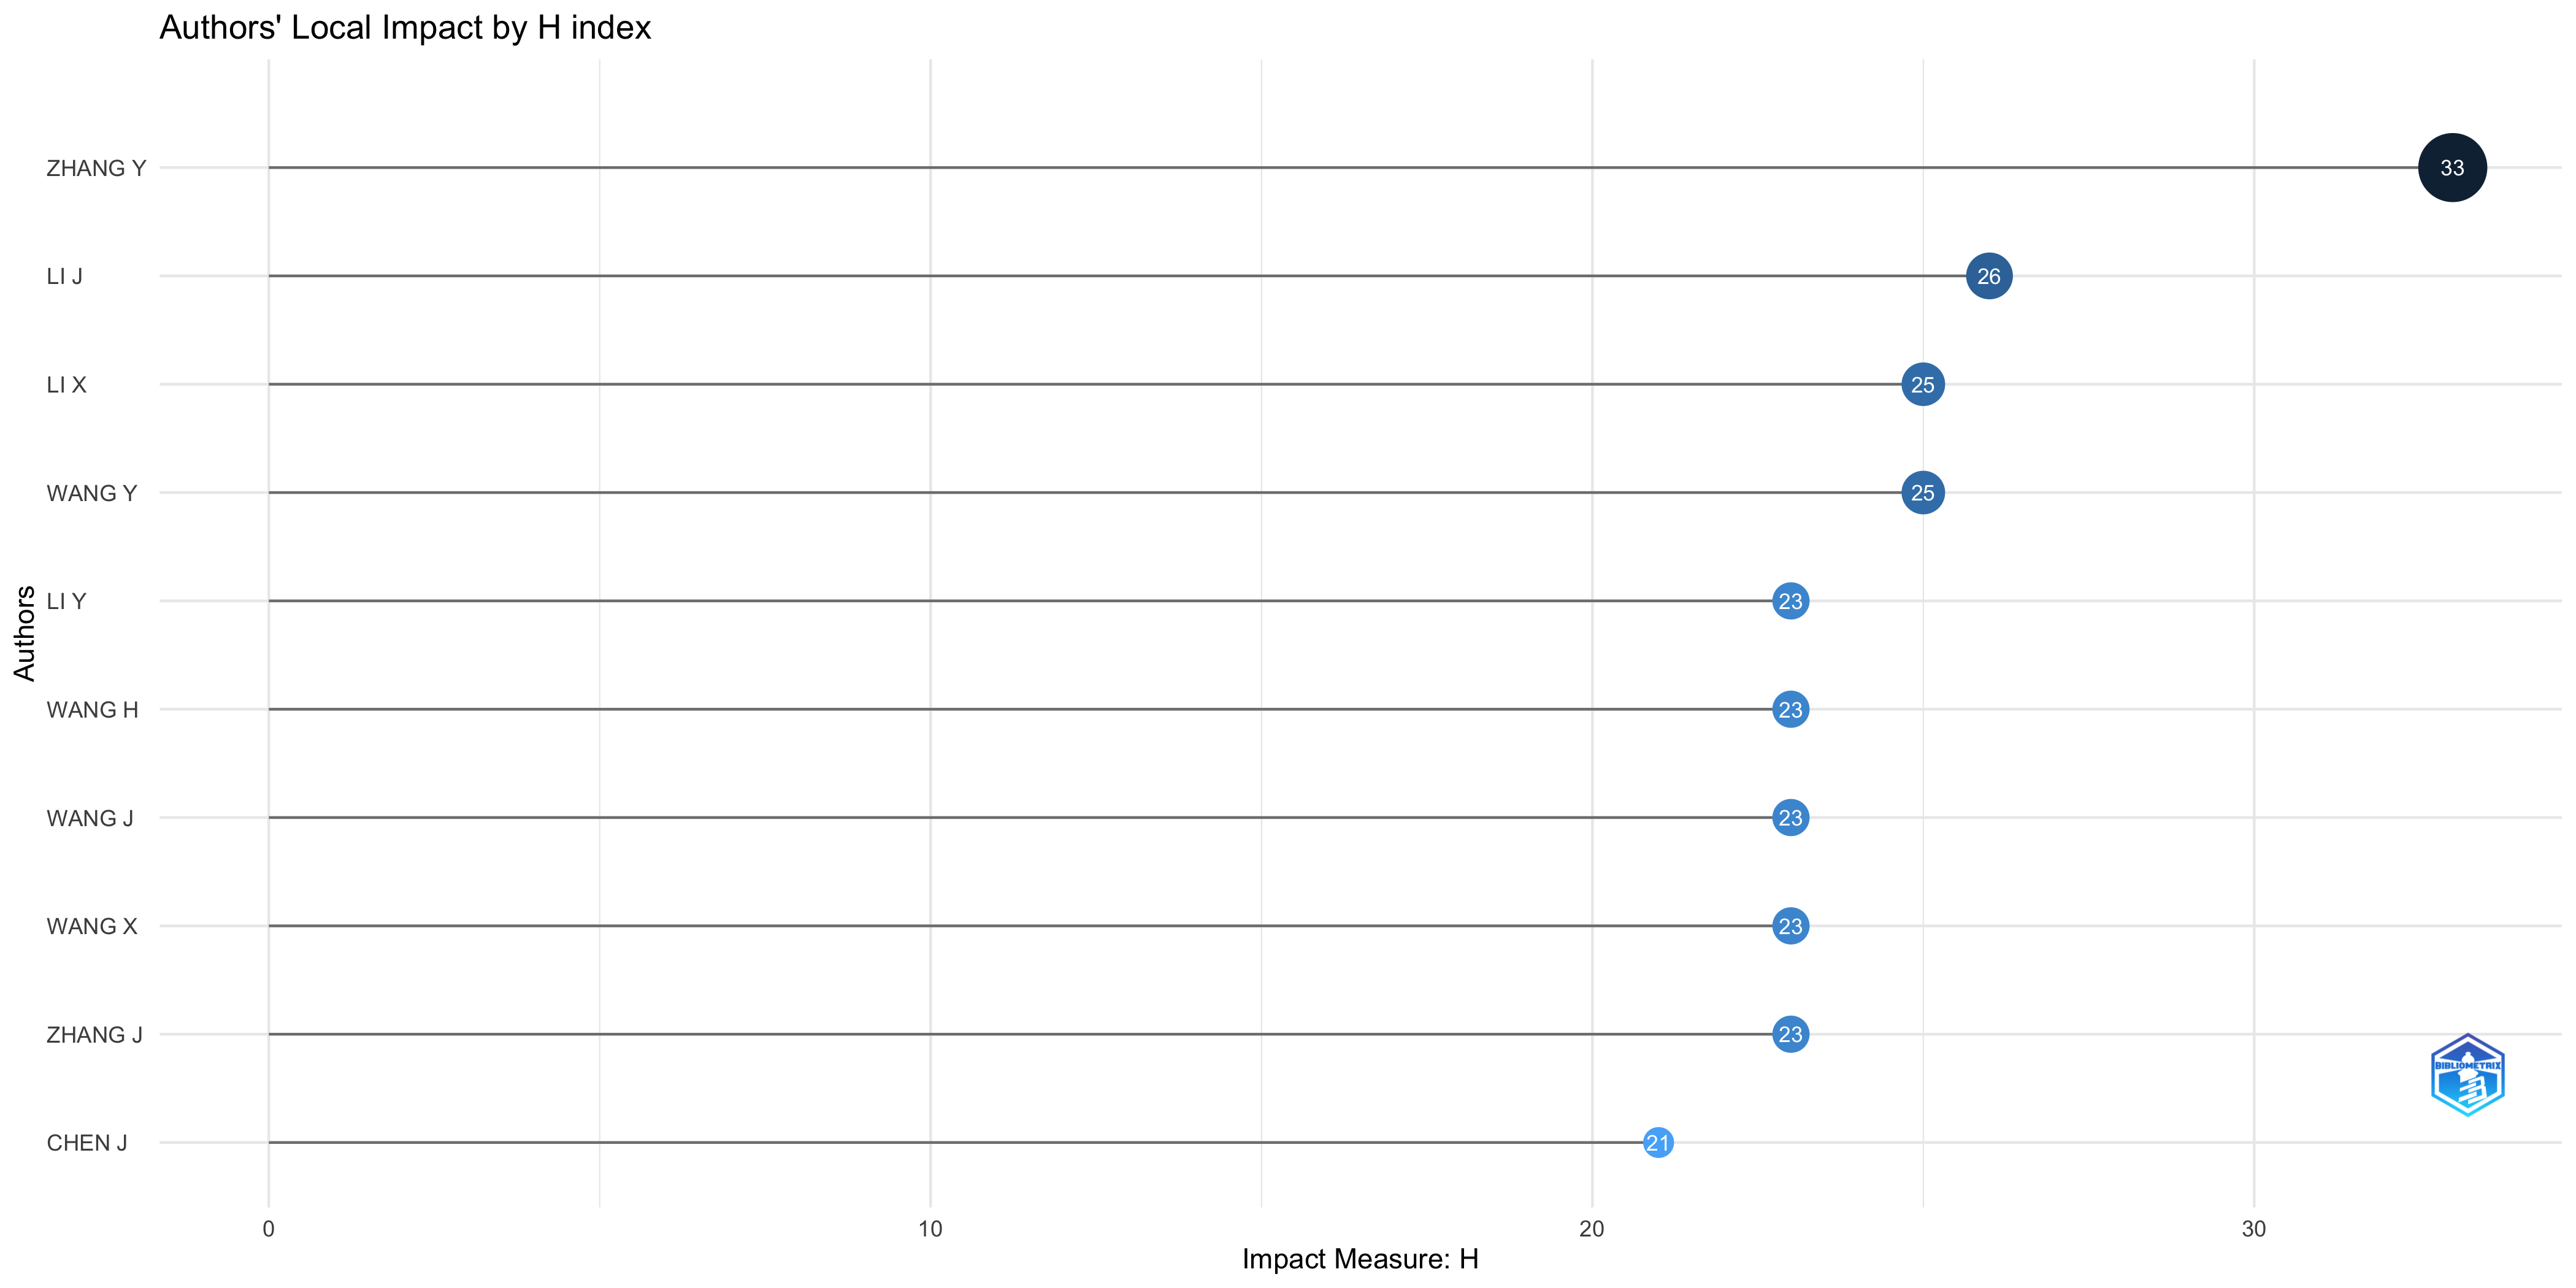
Authors’ Local Impact
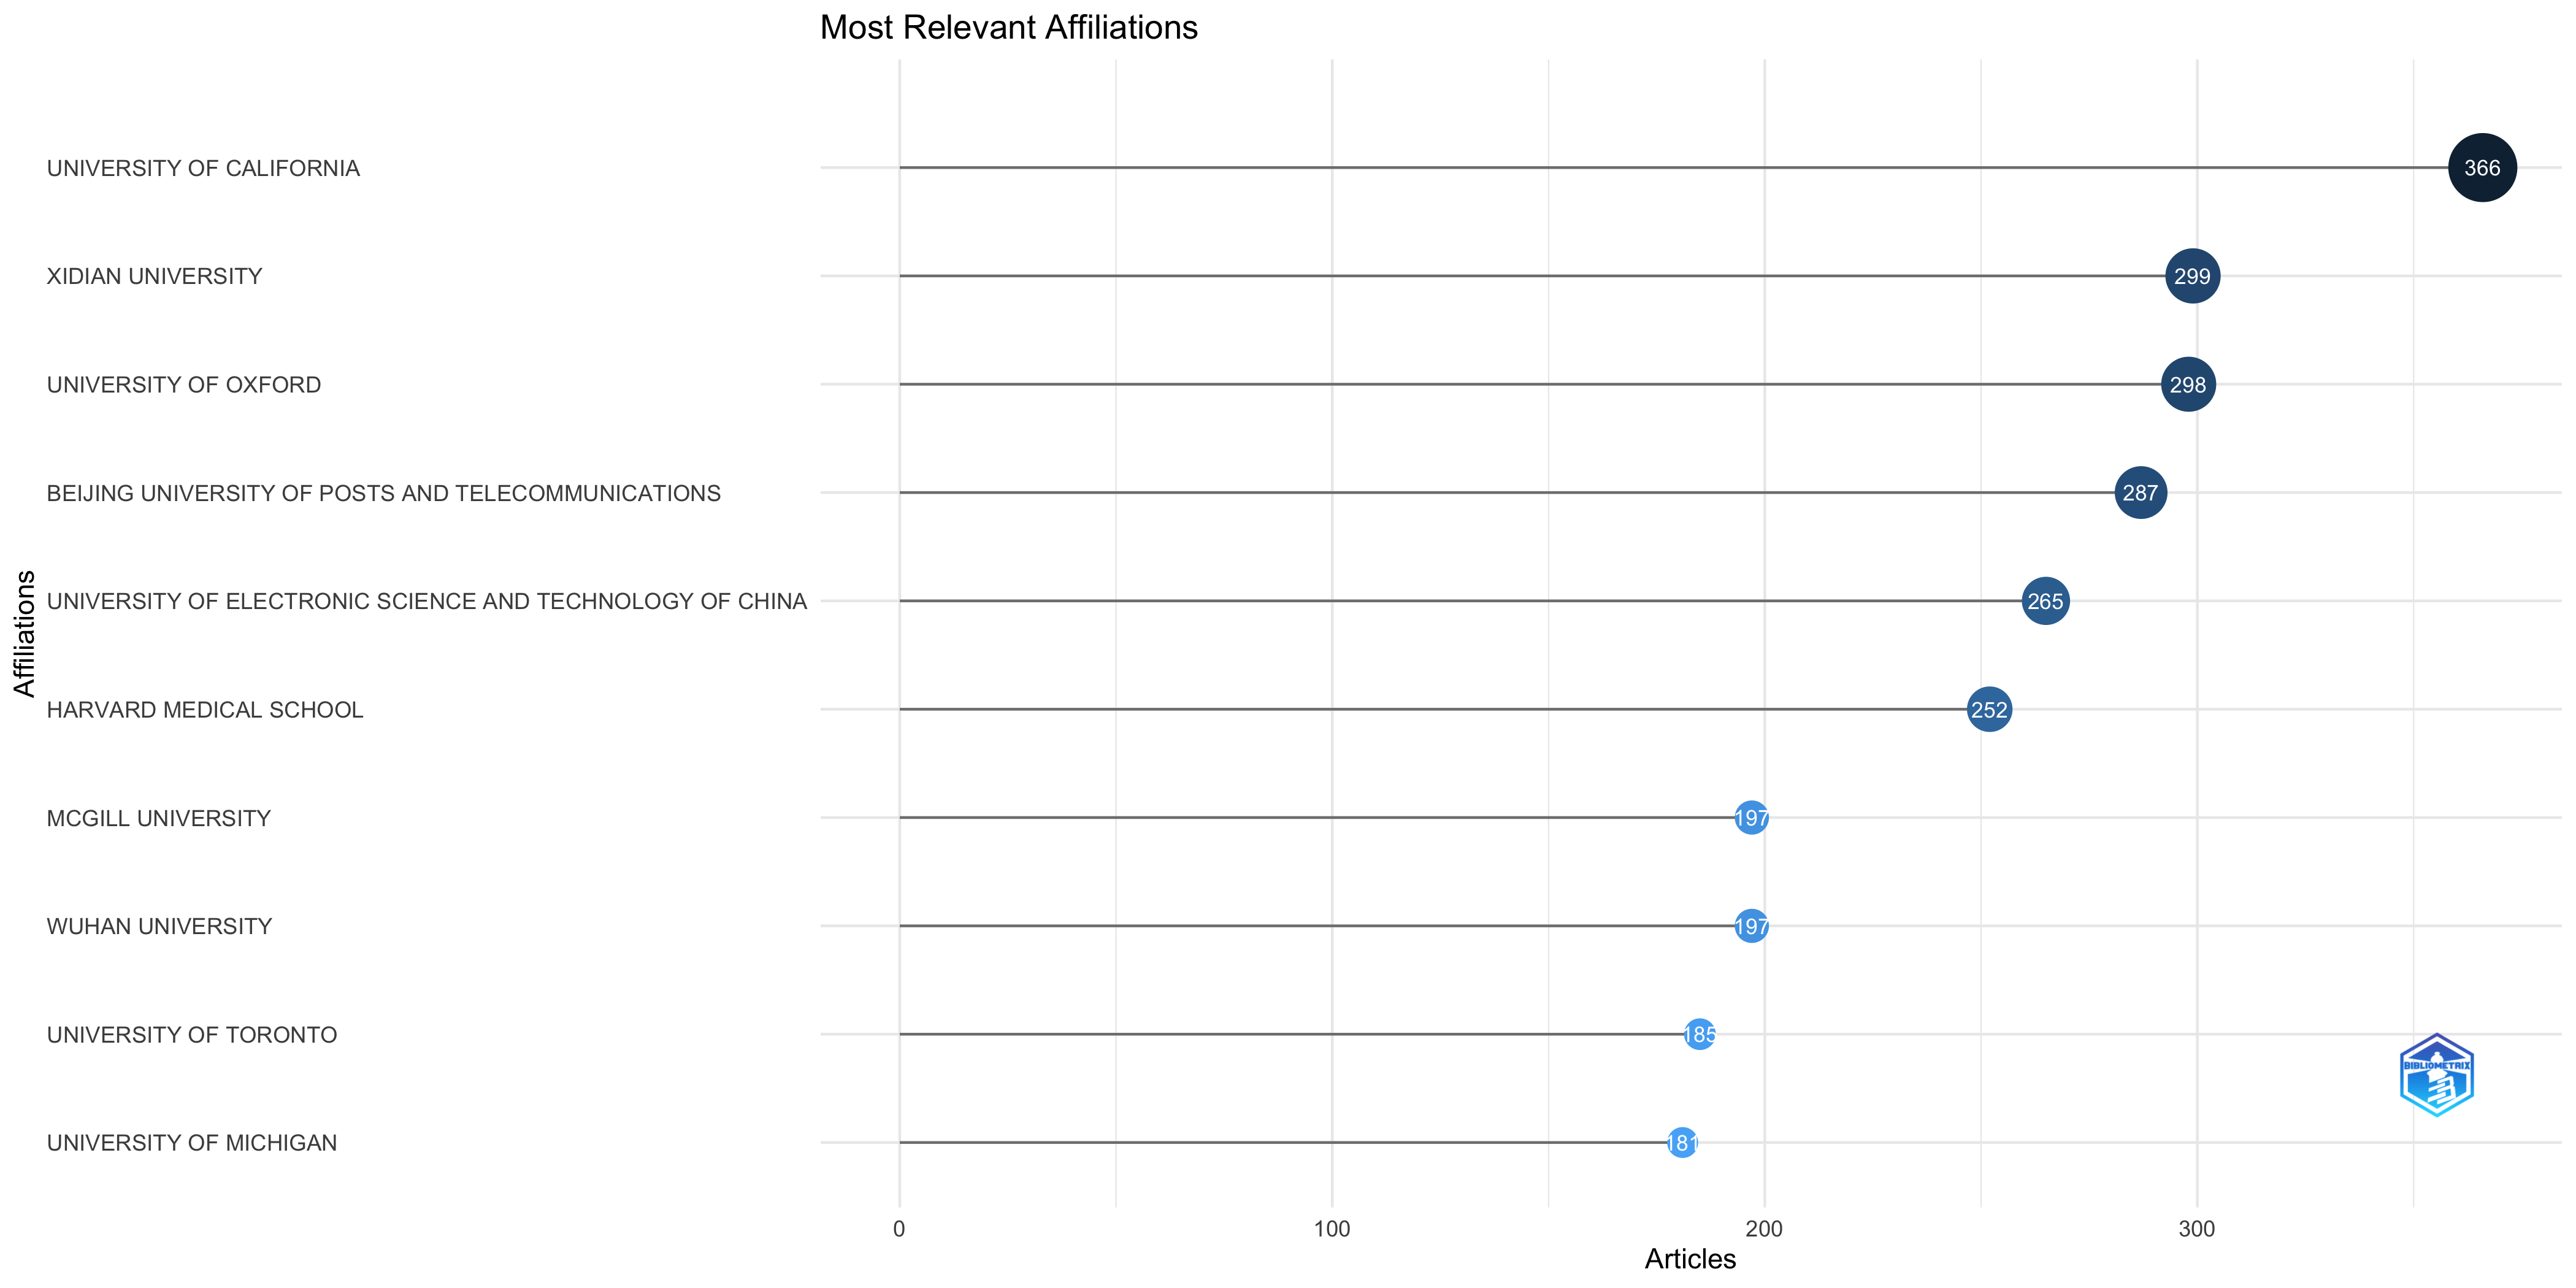
Most Relevant Affiliations
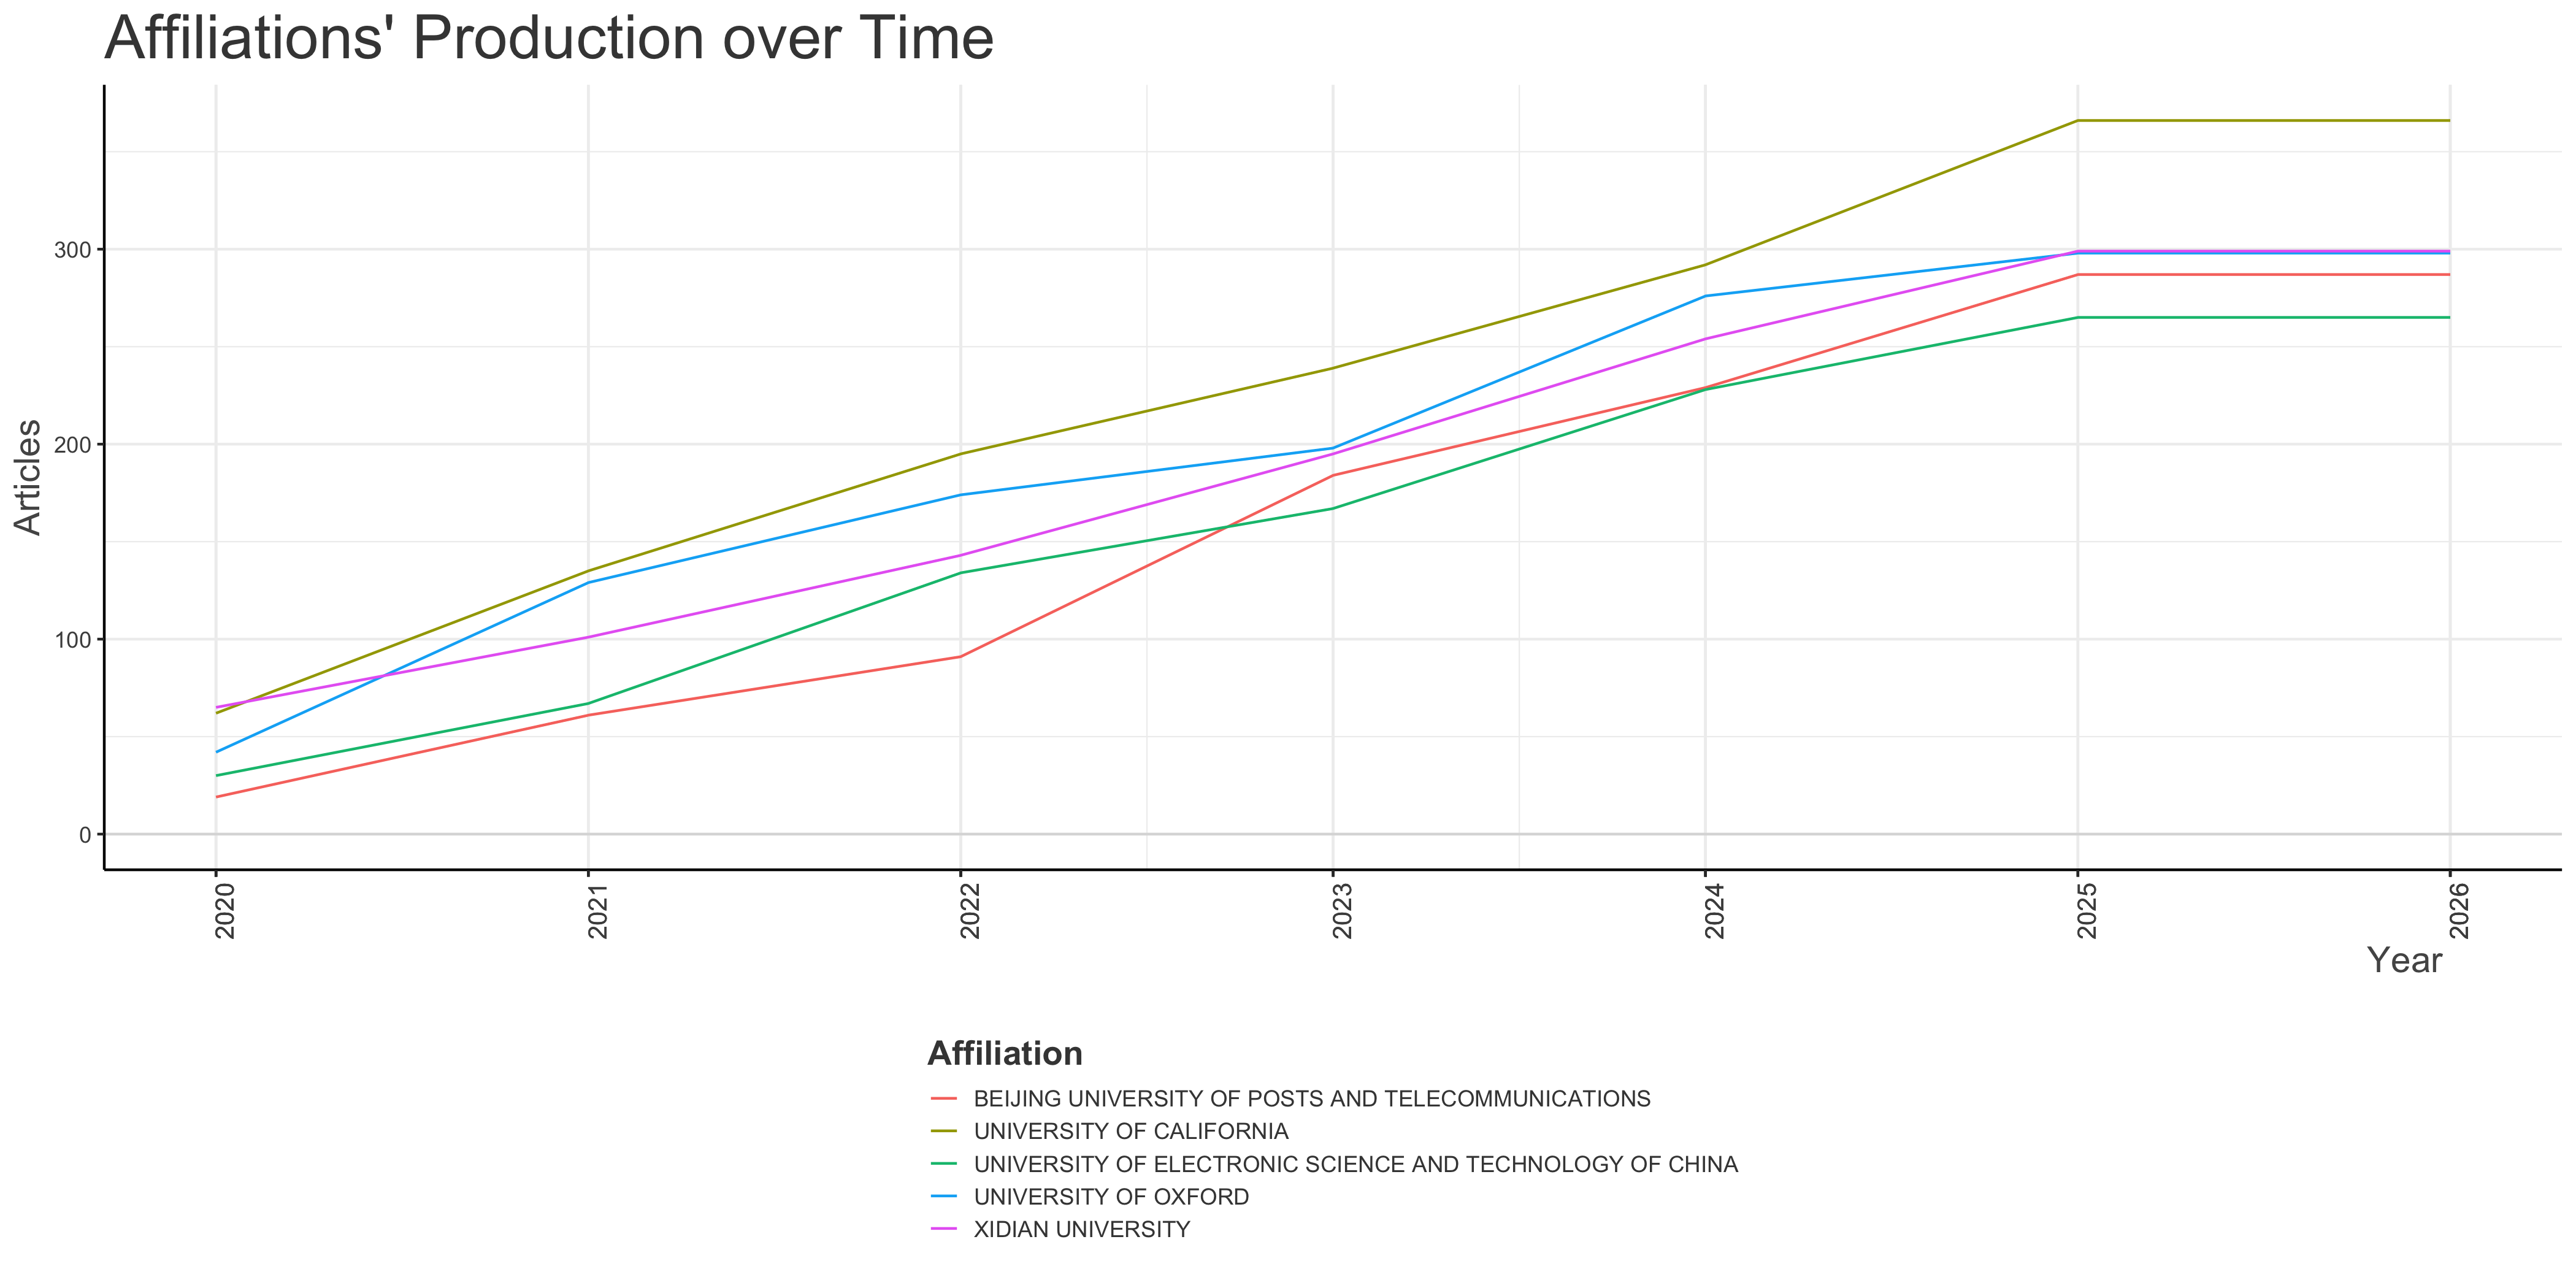
Affiliations’ Production over Time
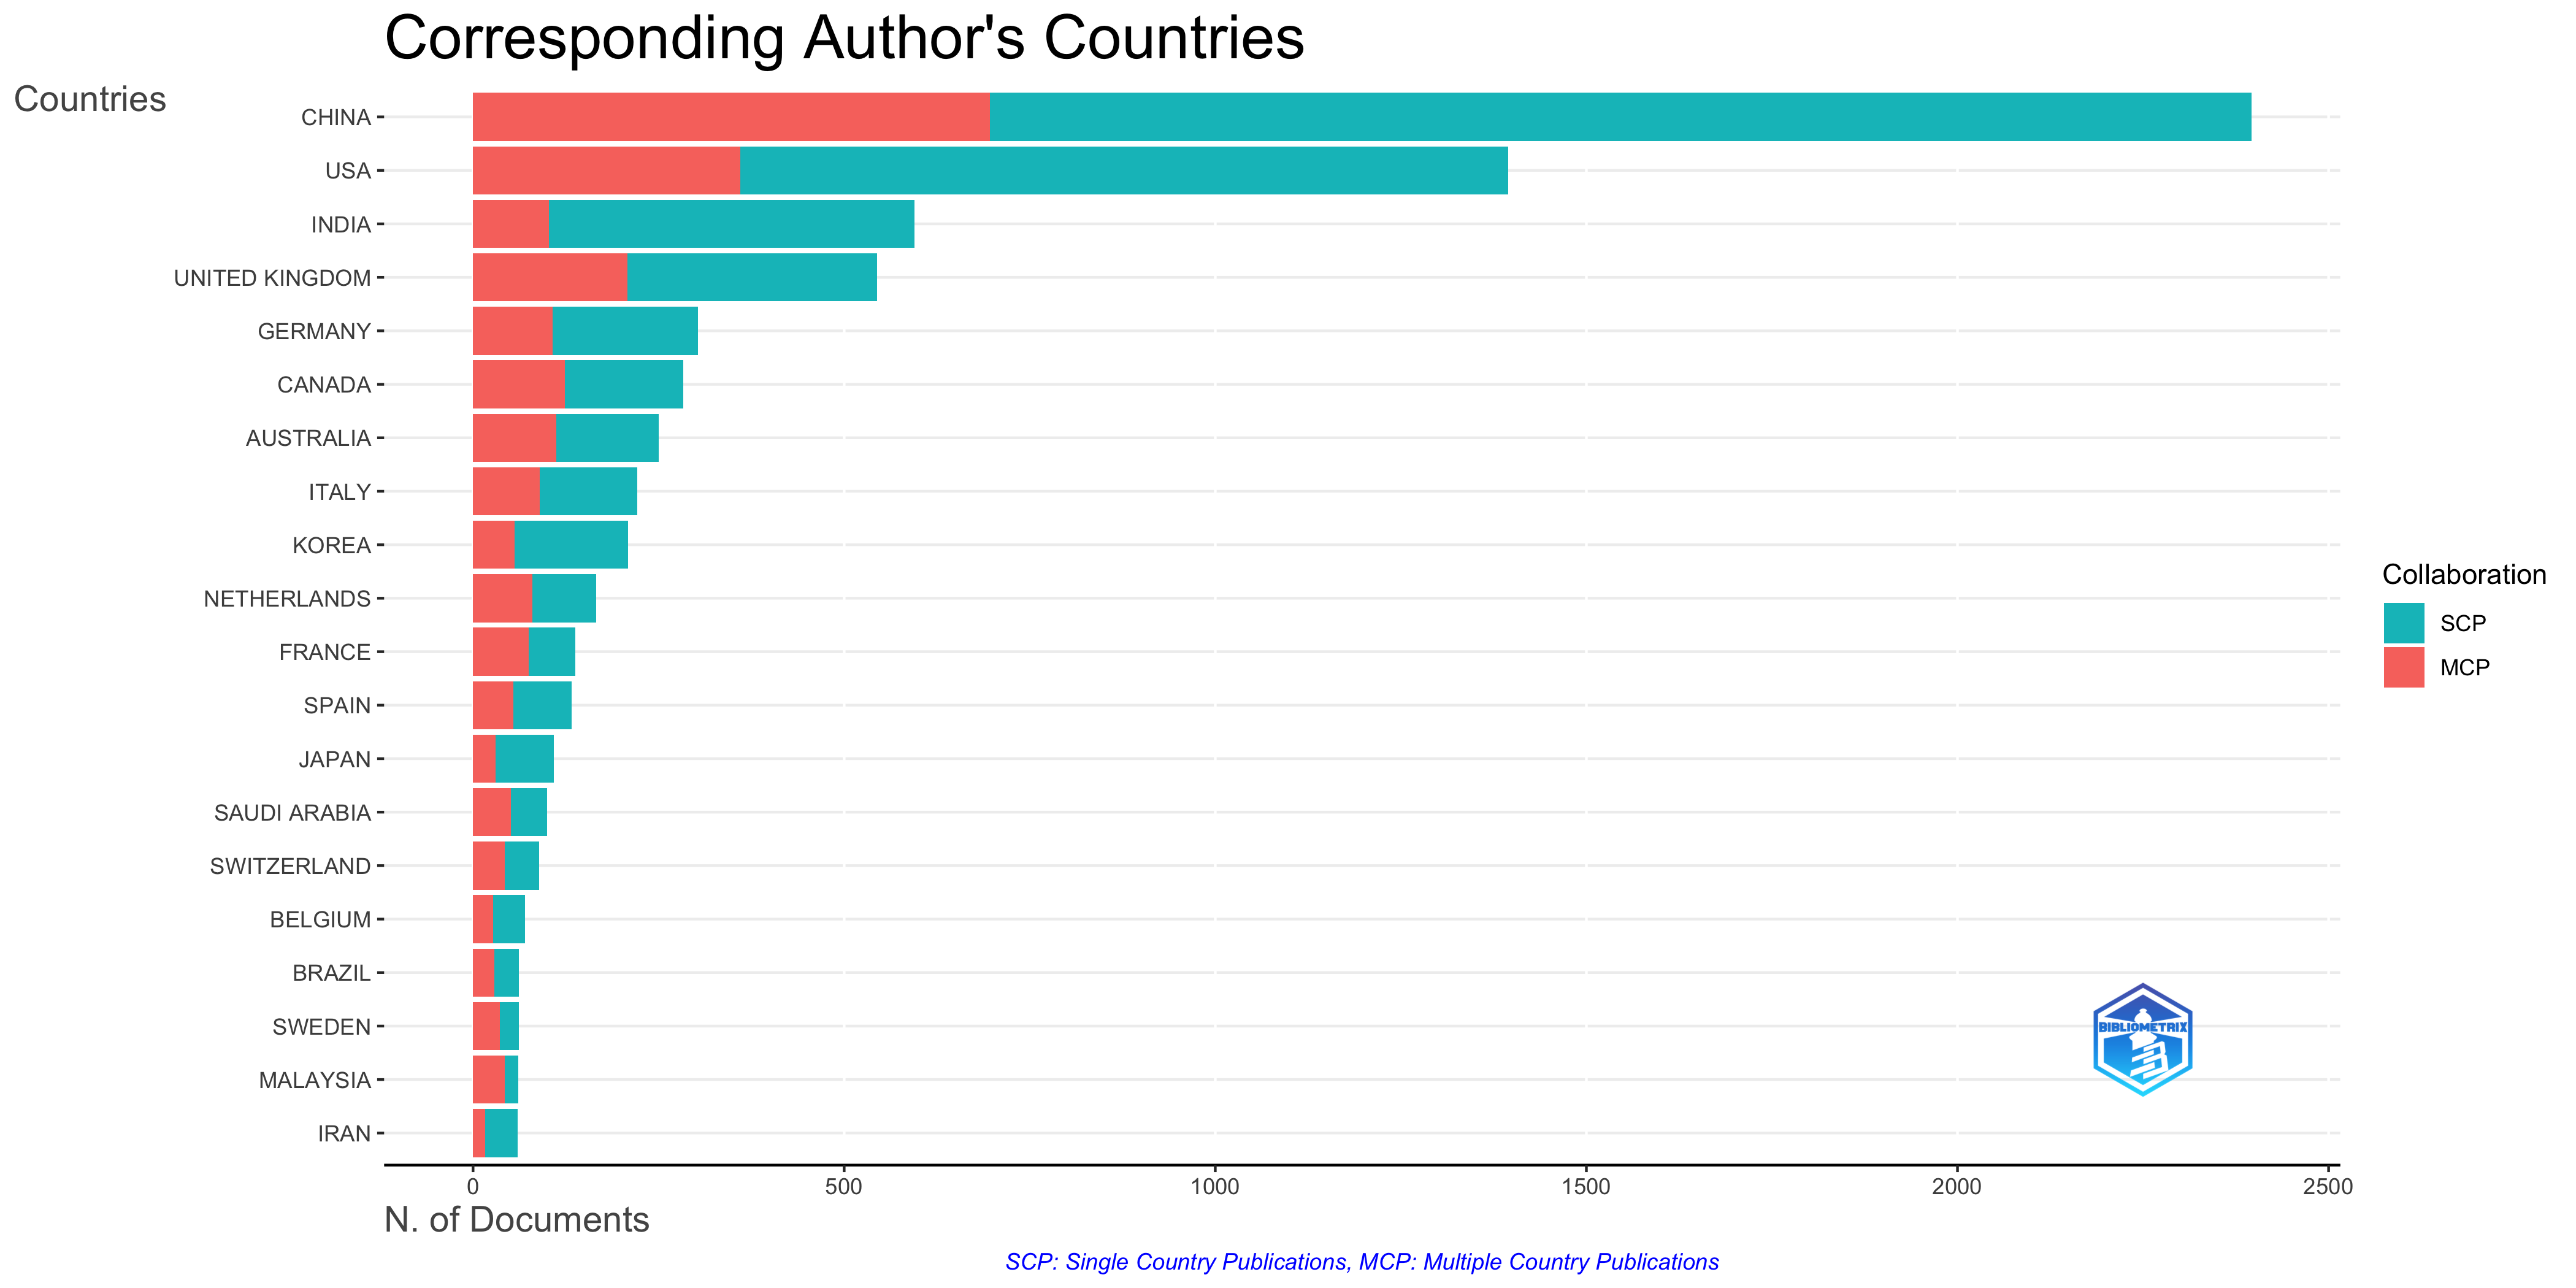
Corresponding Author’s Countries
Overall Trends:
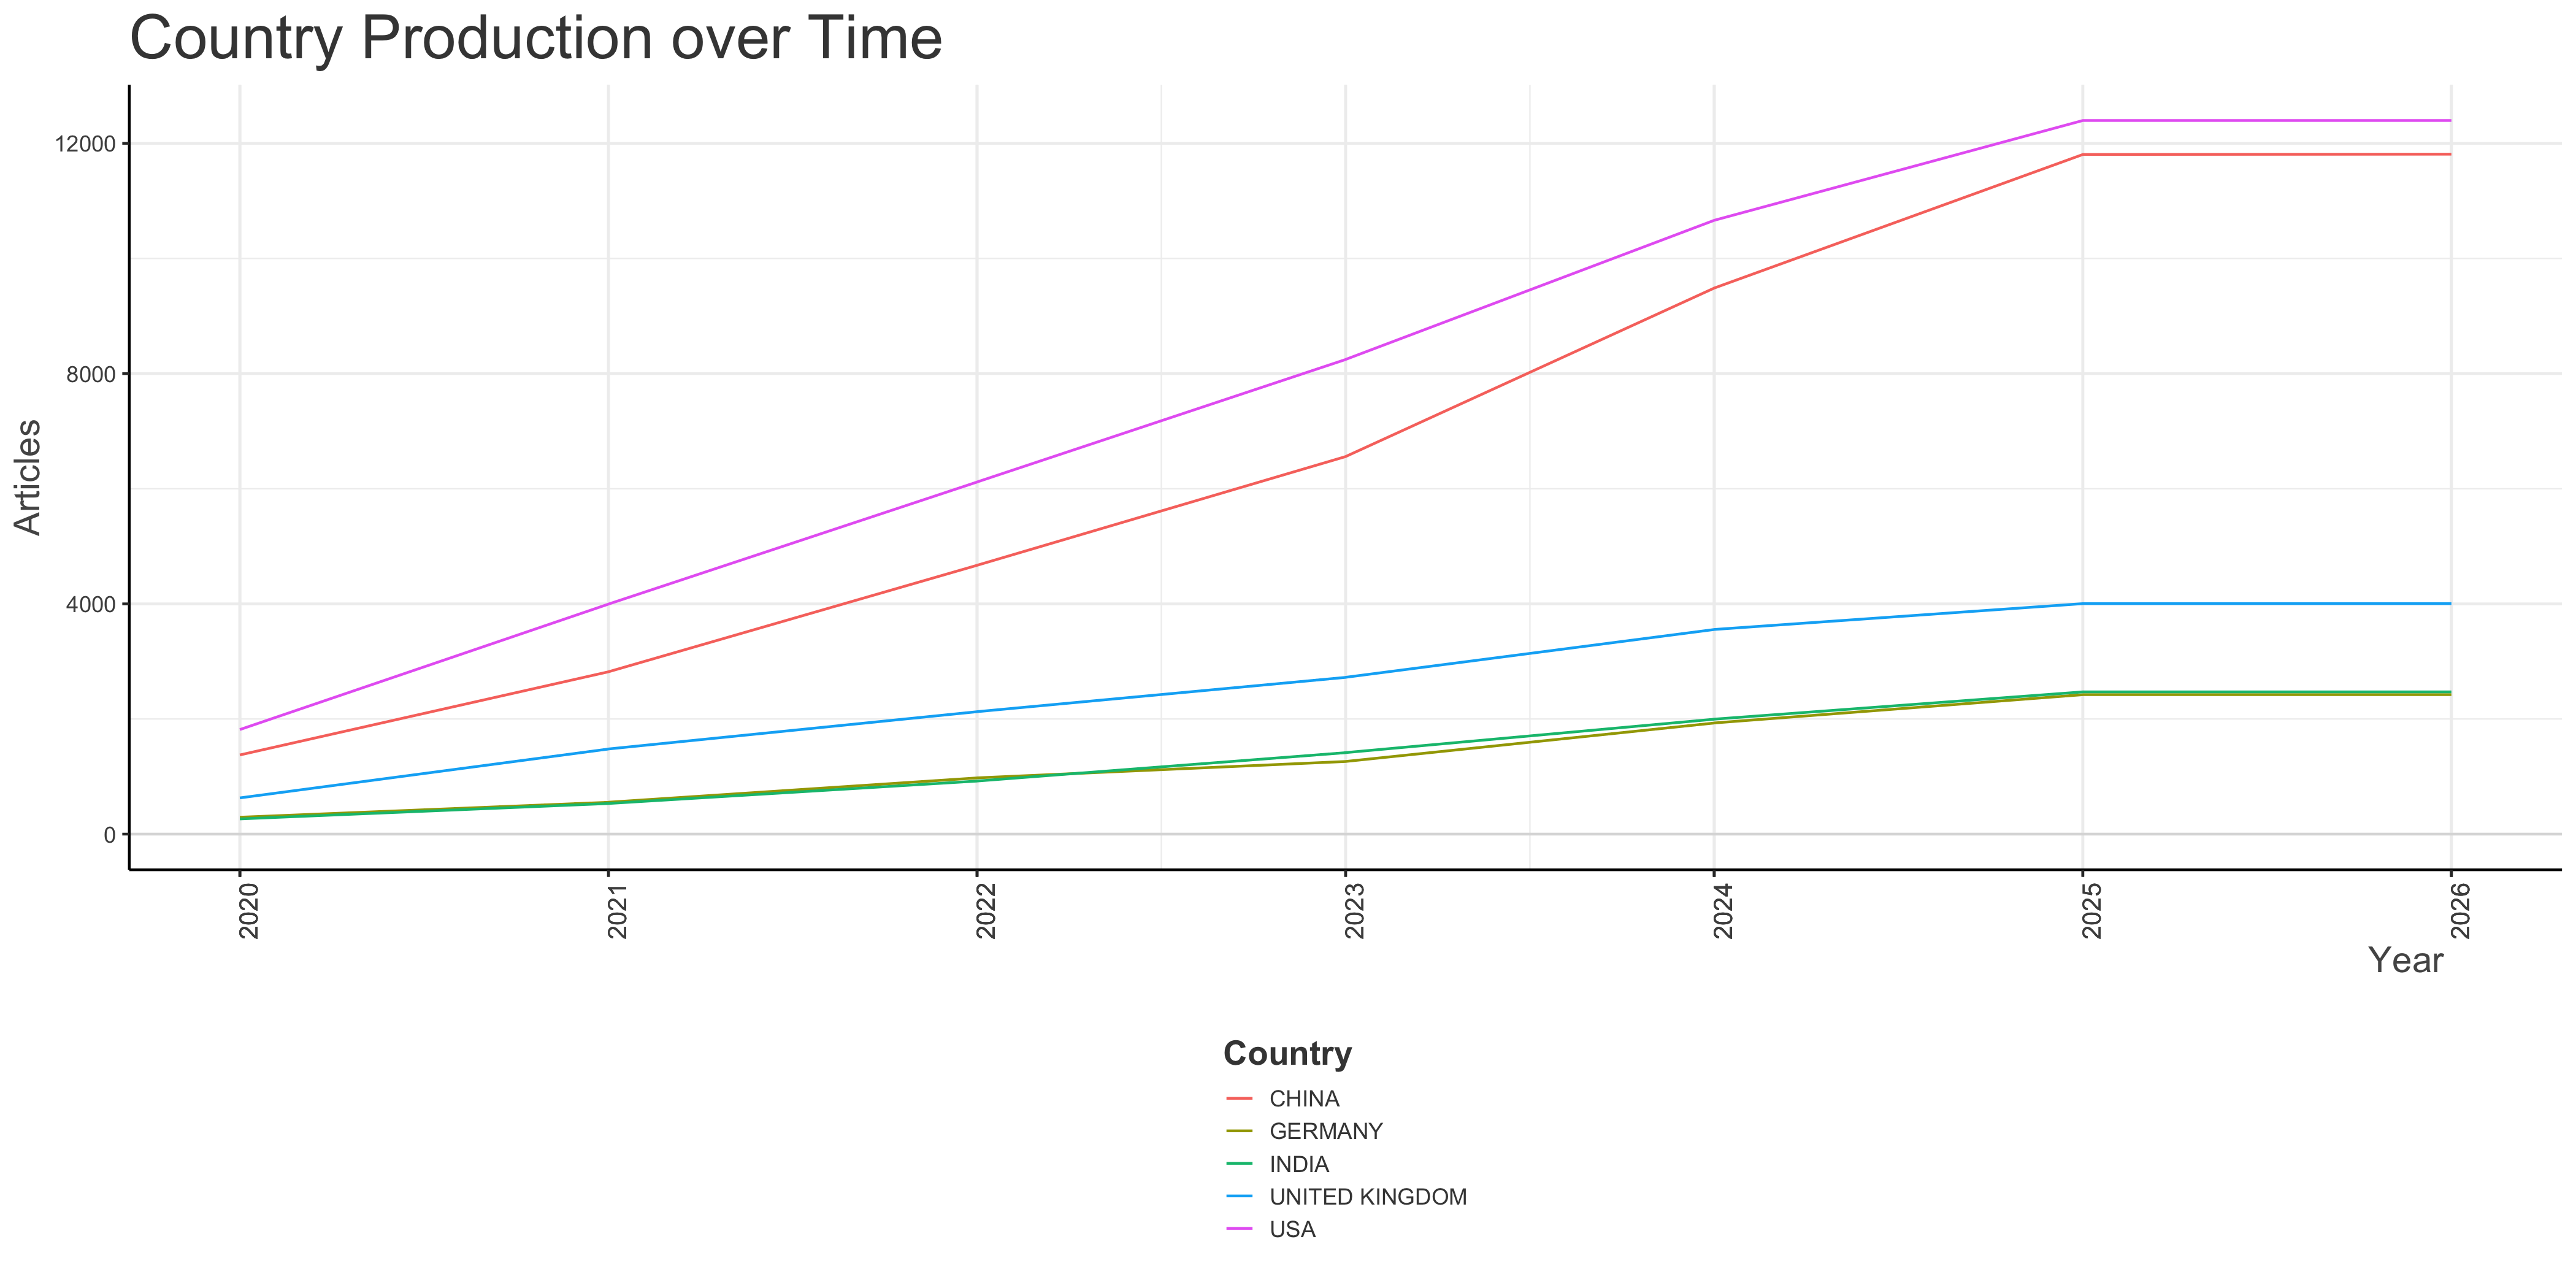
- Dominant Producers: China is the most prolific country in this dataset, followed by the USA, indicating their significant contribution to the research field under analysis. India, the United Kingdom, and Germany also show substantial output.
- Single vs. Multiple Country Publications: Most countries exhibit a higher number of Single Country Publications (SCP) than Multiple Country Publications (MCP), suggesting a strong focus on domestic research. However, the extent of this varies considerably.
Key Observations and Interpretation by Country:
- China: While leading in total publications, China has a relatively lower MCP percentage (29%) compared to some other nations. This suggests a greater emphasis on domestic research output. This could be due to factors like large domestic funding programs, specific national research priorities, or internal collaboration networks.
- USA: Similar to China, the USA has a significant research output with a relatively low MCP percentage (25.8%). This indicates a strong national research capacity.
- India: India’s MCP percentage is quite low at (17.1%). This may reflect a focus on addressing local challenges or a different approach to international collaborations.
- United Kingdom, Germany, Canada, Australia, Italy: These European and Commonwealth nations demonstrate a more balanced approach between domestic and international research, with MCP percentages ranging from approximately 35% to 45%. This could reflect established collaborative networks within Europe and among Commonwealth countries, as well as active participation in global research initiatives.
- Netherlands, France, Saudi Arabia, Switzerland, Brazil, Sweden, Malaysia: These countries have a higher proportion of MCPs, suggesting a greater reliance on international collaboration. Especially Malaysia (70.5%) and Sweden (58.1%). This might be driven by factors like smaller domestic research capacity, specific expertise in certain fields, or strategic partnerships to enhance research impact.
- Saudi Arabia: Interestingly, Saudi Arabia shows a slight majority of MCPs (51%), indicating a strong emphasis on international collaboration, possibly to bolster research capabilities and visibility.
- Korea, Japan, and Iran: These countries have relatively lower MCP percentages (around 26-27%) compared to their overall publication output, indicating a greater focus on domestic research. This could be due to factors like government policies supporting internal research or strong national research institutions.
General Discussion Points:
- Collaboration Strategies: The plot reveals diverse collaboration strategies among different countries. Some countries prioritize domestic research, while others actively engage in international collaborations. These choices are likely influenced by national research policies, funding structures, available resources, and specific research priorities.
- Research Capacity: Countries with a higher total number of publications generally possess a stronger research infrastructure and greater research capacity. However, the MCP percentage indicates how these countries leverage international partnerships to enhance their research efforts.
- Data Source Considerations: The analysis is based on SCOPUS data. Different bibliographic databases may yield slightly different results. The choice of SCOPUS could reflect a specific focus within the research or the availability of data.
- Limitations: It’s important to note that this analysis only considers the corresponding author’s country. Collaboration may exist even in SCP publications if co-authors are from different institutions within the same country. Additionally, the plot does not provide information about the specific fields of research or the nature of the collaborations.
- Further Research: To gain a deeper understanding, it would be beneficial to investigate the specific research areas in which each country excels and the types of collaborations they engage in (e.g., co-authorship, data sharing, joint projects). Investigating national research policies and funding priorities would also provide valuable context.
In summary, this ‘Corresponding Author’s Country Collaboration Plot’ provides a valuable overview of the global landscape of scientific publications, highlighting the varying degrees of domestic and international research engagement among different countries. The insights derived from this plot can inform research policy, funding decisions, and collaboration strategies to promote impactful and globally relevant research.
| CHINA | 2396 | 26.0 | 1700 | 696 | 29.0 |
| USA | 1395 | 15.2 | 1035 | 360 | 25.8 |
| INDIA | 595 | 6.5 | 493 | 102 | 17.1 |
| UNITED KINGDOM | 544 | 5.9 | 336 | 208 | 38.2 |
| GERMANY | 303 | 3.3 | 196 | 107 | 35.3 |
| CANADA | 283 | 3.1 | 159 | 124 | 43.8 |
| AUSTRALIA | 250 | 2.7 | 138 | 112 | 44.8 |
| ITALY | 221 | 2.4 | 131 | 90 | 40.7 |
| KOREA | 209 | 2.3 | 153 | 56 | 26.8 |
| NETHERLANDS | 166 | 1.8 | 86 | 80 | 48.2 |
| FRANCE | 138 | 1.5 | 63 | 75 | 54.3 |
| SPAIN | 133 | 1.4 | 79 | 54 | 40.6 |
| JAPAN | 109 | 1.2 | 79 | 30 | 27.5 |
| SAUDI ARABIA | 100 | 1.1 | 49 | 51 | 51.0 |
| SWITZERLAND | 89 | 1.0 | 46 | 43 | 48.3 |
| BELGIUM | 70 | 0.8 | 43 | 27 | 38.6 |
| BRAZIL | 62 | 0.7 | 33 | 29 | 46.8 |
| SWEDEN | 62 | 0.7 | 26 | 36 | 58.1 |
| MALAYSIA | 61 | 0.7 | 18 | 43 | 70.5 |
| IRAN | 60 | 0.7 | 44 | 16 | 26.7 |
| NORWAY | 59 | 0.6 | 27 | 32 | 54.2 |
| SOUTH AFRICA | 53 | 0.6 | 31 | 22 | 41.5 |
| FINLAND | 51 | 0.6 | 24 | 27 | 52.9 |
| PAKISTAN | 51 | 0.6 | 16 | 35 | 68.6 |
| SINGAPORE | 49 | 0.5 | 21 | 28 | 57.1 |
| TURKEY | 47 | 0.5 | 38 | 9 | 19.1 |
| IRELAND | 45 | 0.5 | 20 | 25 | 55.6 |
| AUSTRIA | 43 | 0.5 | 17 | 26 | 60.5 |
| DENMARK | 41 | 0.4 | 17 | 24 | 58.5 |
| HONG KONG | 39 | 0.4 | 14 | 25 | 64.1 |
| PORTUGAL | 39 | 0.4 | 25 | 14 | 35.9 |
| POLAND | 36 | 0.4 | 25 | 11 | 30.6 |
| GREECE | 33 | 0.4 | 22 | 11 | 33.3 |
| INDONESIA | 33 | 0.4 | 25 | 8 | 24.2 |
| THAILAND | 26 | 0.3 | 20 | 6 | 23.1 |
| EGYPT | 25 | 0.3 | 15 | 10 | 40.0 |
| ISRAEL | 24 | 0.3 | 16 | 8 | 33.3 |
| IRAQ | 22 | 0.2 | 16 | 6 | 27.3 |
| GEORGIA | 20 | 0.2 | 13 | 7 | 35.0 |
| JORDAN | 18 | 0.2 | 10 | 8 | 44.4 |
| NIGERIA | 17 | 0.2 | 11 | 6 | 35.3 |
| UNITED ARAB EMIRATES | 17 | 0.2 | 3 | 14 | 82.4 |
| NEW ZEALAND | 16 | 0.2 | 7 | 9 | 56.3 |
| MOROCCO | 15 | 0.2 | 11 | 4 | 26.7 |
| TUNISIA | 15 | 0.2 | 6 | 9 | 60.0 |
| BANGLADESH | 14 | 0.2 | 8 | 6 | 42.9 |
| CZECH REPUBLIC | 14 | 0.2 | 9 | 5 | 35.7 |
| QATAR | 13 | 0.1 | 6 | 7 | 53.8 |
| CROATIA | 12 | 0.1 | 6 | 6 | 50.0 |
| MEXICO | 12 | 0.1 | 6 | 6 | 50.0 |
| KENYA | 11 | 0.1 | 5 | 6 | 54.5 |
| ALGERIA | 10 | 0.1 | 7 | 3 | 30.0 |
| HUNGARY | 10 | 0.1 | 6 | 4 | 40.0 |
| LUXEMBOURG | 10 | 0.1 | 6 | 4 | 40.0 |
| ROMANIA | 10 | 0.1 | 7 | 3 | 30.0 |
| ETHIOPIA | 8 | 0.1 | 1 | 7 | 87.5 |
| GHANA | 8 | 0.1 | 3 | 5 | 62.5 |
| CYPRUS | 7 | 0.1 | 1 | 6 | 85.7 |
| TANZANIA | 7 | 0.1 | 5 | 2 | 28.6 |
| ESTONIA | 6 | 0.1 | 4 | 2 | 33.3 |
| OMAN | 6 | 0.1 | 3 | 3 | 50.0 |
| SLOVENIA | 6 | 0.1 | 4 | 2 | 33.3 |
| UGANDA | 6 | 0.1 | 0 | 6 | 100.0 |
| BOTSWANA | 5 | 0.1 | 2 | 3 | 60.0 |
| PHILIPPINES | 5 | 0.1 | 5 | 0 | 0.0 |
| CONGO | 4 | 0.0 | 0 | 4 | 100.0 |
| LATVIA | 4 | 0.0 | 3 | 1 | 25.0 |
| LEBANON | 4 | 0.0 | 3 | 1 | 25.0 |
| SERBIA | 4 | 0.0 | 4 | 0 | 0.0 |
| SLOVAKIA | 4 | 0.0 | 2 | 2 | 50.0 |
| ZAMBIA | 4 | 0.0 | 1 | 3 | 75.0 |
| ARGENTINA | 3 | 0.0 | 0 | 3 | 100.0 |
| BARBADOS | 3 | 0.0 | 1 | 2 | 66.7 |
| BULGARIA | 3 | 0.0 | 2 | 1 | 33.3 |
| COLOMBIA | 3 | 0.0 | 1 | 2 | 66.7 |
| COSTA RICA | 3 | 0.0 | 0 | 3 | 100.0 |
| KAZAKHSTAN | 3 | 0.0 | 0 | 3 | 100.0 |
| MONTENEGRO | 3 | 0.0 | 1 | 2 | 66.7 |
| NEPAL | 3 | 0.0 | 0 | 3 | 100.0 |
| SRI LANKA | 3 | 0.0 | 1 | 2 | 66.7 |
| CAMEROON | 2 | 0.0 | 0 | 2 | 100.0 |
| CHILE | 2 | 0.0 | 1 | 1 | 50.0 |
| JAMAICA | 2 | 0.0 | 2 | 0 | 0.0 |
| KUWAIT | 2 | 0.0 | 0 | 2 | 100.0 |
| LITHUANIA | 2 | 0.0 | 0 | 2 | 100.0 |
| MALTA | 2 | 0.0 | 2 | 0 | 0.0 |
| RUSSIA | 2 | 0.0 | 2 | 0 | 0.0 |
| SUDAN | 2 | 0.0 | 1 | 1 | 50.0 |
| VIETNAM | 2 | 0.0 | 2 | 0 | 0.0 |
| YEMEN | 2 | 0.0 | 0 | 2 | 100.0 |
| ZIMBABWE | 2 | 0.0 | 1 | 1 | 50.0 |
| AFGHANISTAN | 1 | 0.0 | 0 | 1 | 100.0 |
| ARMENIA | 1 | 0.0 | 1 | 0 | 0.0 |
| BAHRAIN | 1 | 0.0 | 0 | 1 | 100.0 |
| CAMBODIA | 1 | 0.0 | 0 | 1 | 100.0 |
| CHAD | 1 | 0.0 | 1 | 0 | 0.0 |
| ECUADOR | 1 | 0.0 | 0 | 1 | 100.0 |
| GUINEA | 1 | 0.0 | 0 | 1 | 100.0 |
| ICELAND | 1 | 0.0 | 1 | 0 | 0.0 |
| LAOS | 1 | 0.0 | 0 | 1 | 100.0 |
| MACEDONIA | 1 | 0.0 | 0 | 1 | 100.0 |
| MADAGASCAR | 1 | 0.0 | 0 | 1 | 100.0 |
| MALI | 1 | 0.0 | 0 | 1 | 100.0 |
| MAURITIUS | 1 | 0.0 | 0 | 1 | 100.0 |
| NAMIBIA | 1 | 0.0 | 1 | 0 | 0.0 |
| PALAU | 1 | 0.0 | 1 | 0 | 0.0 |
| PERU | 1 | 0.0 | 0 | 1 | 100.0 |
| RWANDA | 1 | 0.0 | 1 | 0 | 0.0 |
| TRINIDAD AND TOBAGO | 1 | 0.0 | 1 | 0 | 0.0 |
| UKRAINE | 1 | 0.0 | 1 | 0 | 0.0 |
| UZBEKISTAN | 1 | 0.0 | 0 | 1 |
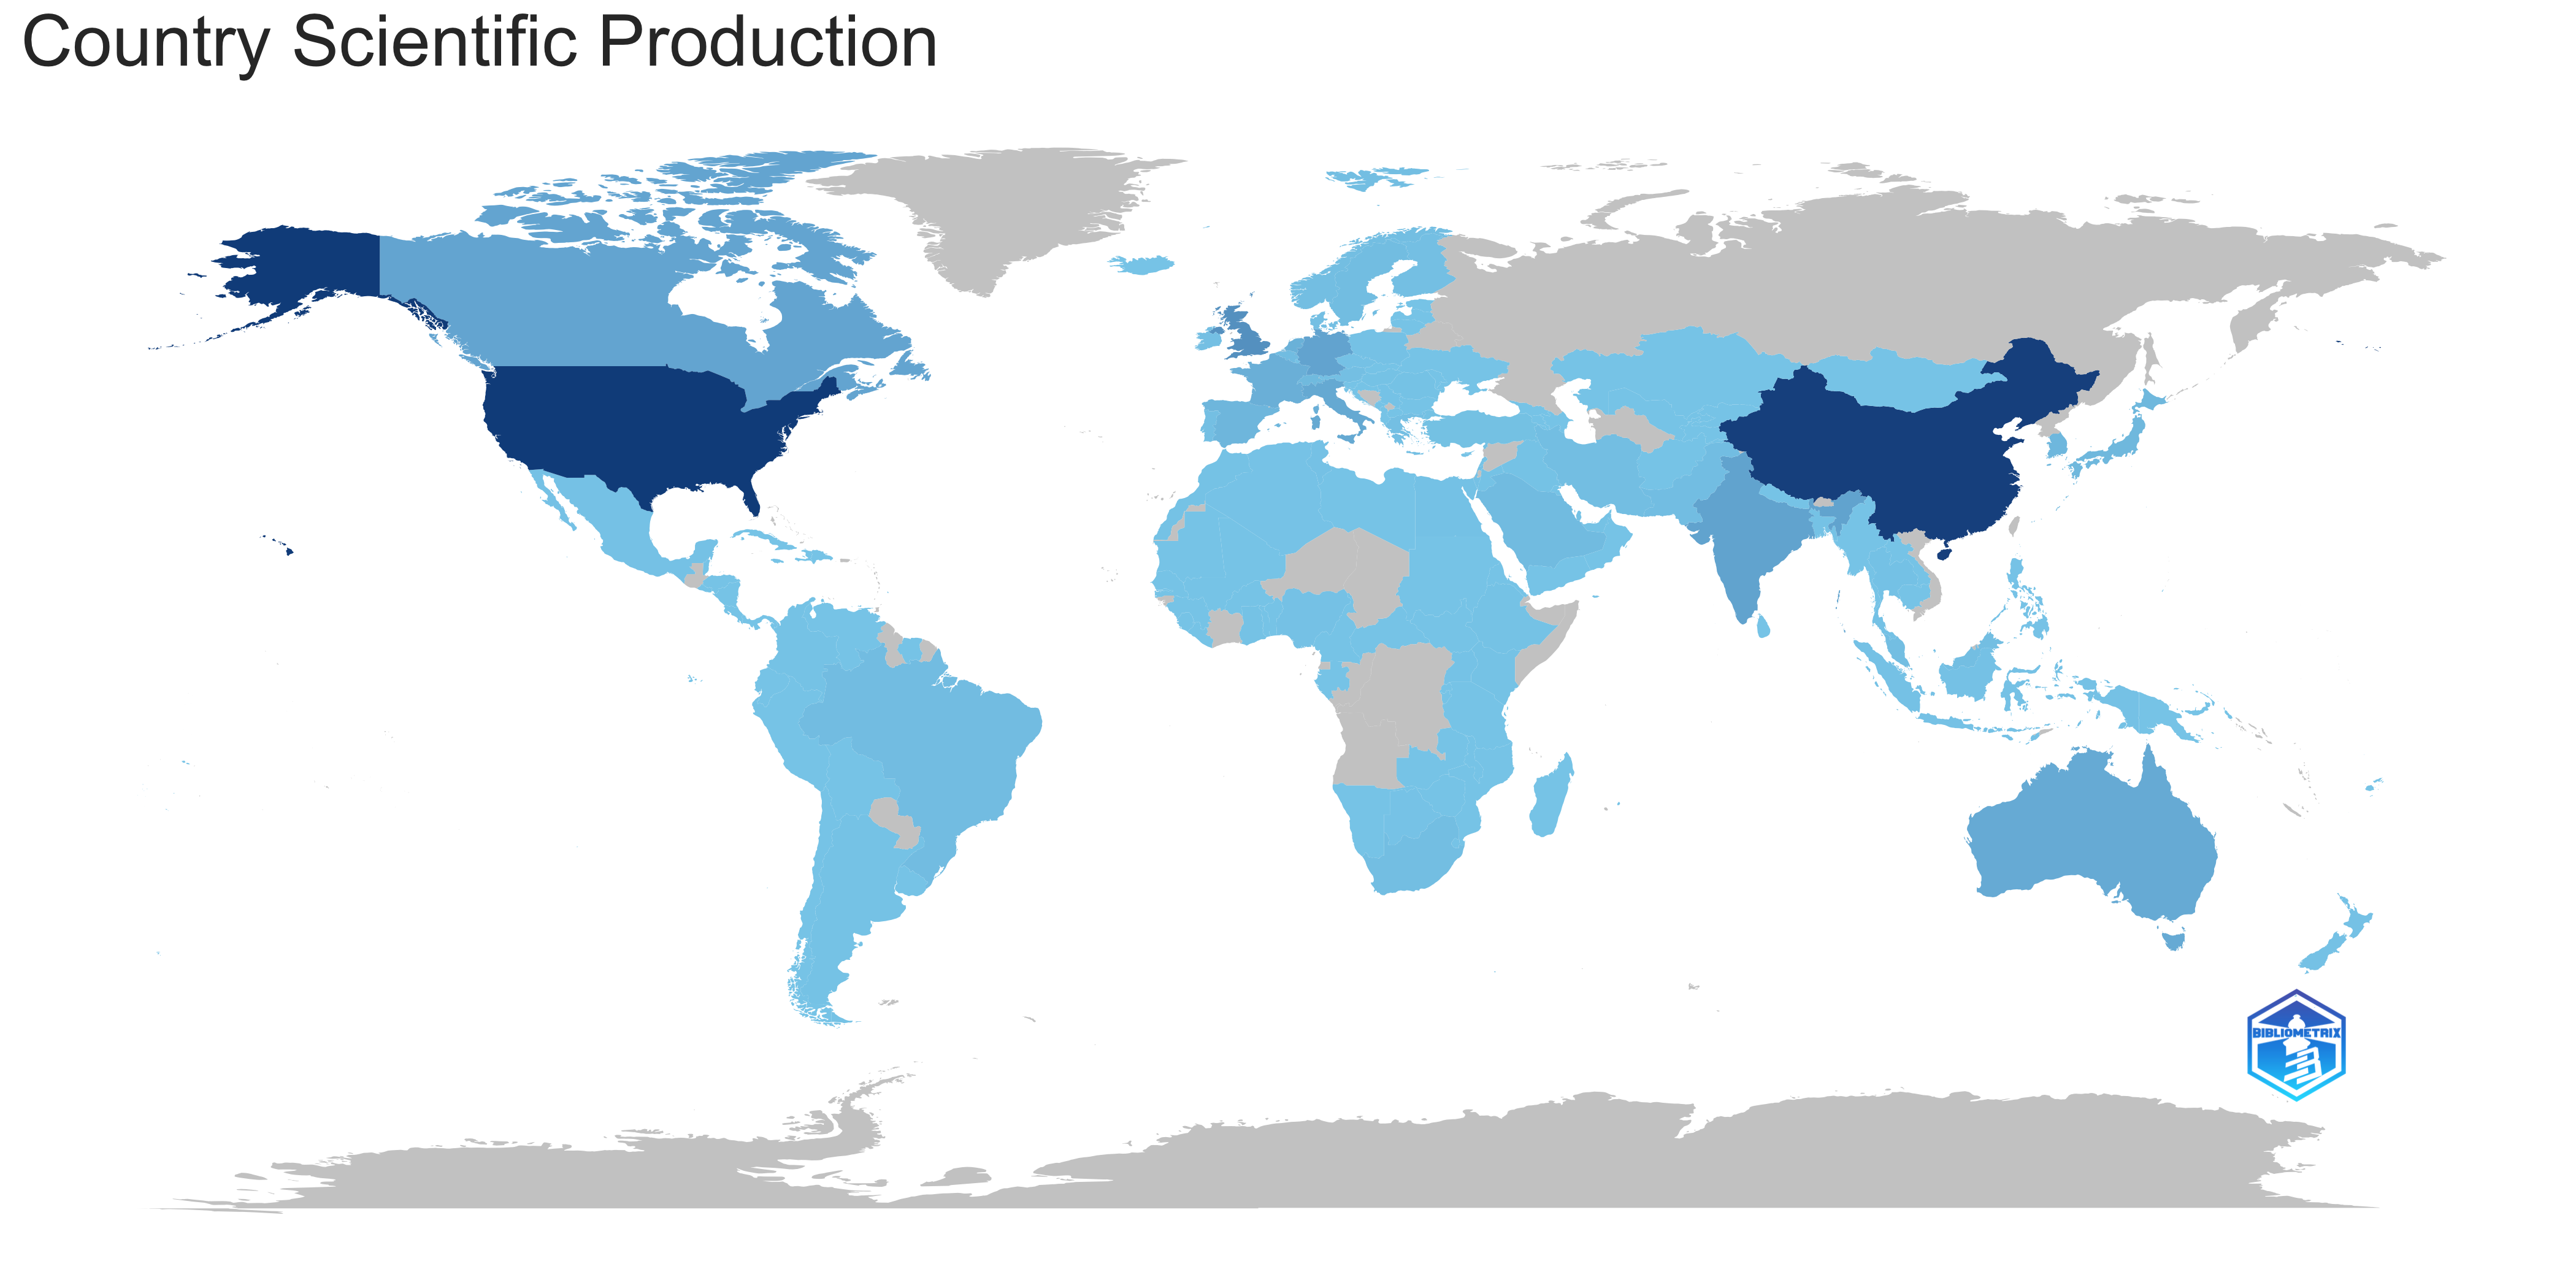
Countries’ Scientific Production
| USA | 12397 |
| CHINA | 11812 |
| UK | 4004 |
| INDIA | 2471 |
| GERMANY | 2423 |
| CANADA | 2321 |
| ITALY | 1996 |
| AUSTRALIA | 1935 |
| FRANCE | 1494 |
| NETHERLANDS | 1382 |
| SPAIN | 969 |
| SOUTH KOREA | 929 |
| JAPAN | 829 |
| SWITZERLAND | 714 |
| SAUDI ARABIA | 638 |
| BELGIUM | 554 |
| BRAZIL | 539 |
| SWEDEN | 445 |
| PAKISTAN | 426 |
| SINGAPORE | 370 |
| NORWAY | 362 |
| MALAYSIA | 333 |
| SOUTH AFRICA | 319 |
| IRAN | 316 |
| AUSTRIA | 295 |
| FINLAND | 285 |
| DENMARK | 282 |
| GREECE | 271 |
| IRELAND | 248 |
| PORTUGAL | 232 |
| TURKEY | 219 |
| EGYPT | 185 |
| THAILAND | 182 |
| INDONESIA | 176 |
| ISRAEL | 176 |
| POLAND | 174 |
| NIGERIA | 162 |
| TUNISIA | 152 |
| CZECH REPUBLIC | 148 |
| MEXICO | 139 |
| NEW ZEALAND | 136 |
| JORDAN | 133 |
| UNITED ARAB EMIRATES | 126 |
| KENYA | 109 |
| IRAQ | 101 |
| BANGLADESH | 99 |
| MOROCCO | 85 |
| GHANA | 84 |
| QATAR | 84 |
| ROMANIA | 81 |
| HUNGARY | 76 |
| ARGENTINA | 75 |
| LUXEMBOURG | 70 |
| ETHIOPIA | 69 |
| COLOMBIA | 68 |
| SERBIA | 62 |
| UGANDA | 61 |
| PHILIPPINES | 58 |
| ALGERIA | 48 |
| BOTSWANA | 48 |
| CROATIA | 43 |
| ESTONIA | 43 |
| TANZANIA | 38 |
| CHILE | 37 |
| LAOS | 36 |
| SLOVENIA | 34 |
| CYPRUS | 33 |
| OMAN | 33 |
| NEPAL | 32 |
| PERU | 32 |
| SUDAN | 32 |
| CAMEROON | 29 |
| SRI LANKA | 29 |
| ICELAND | 28 |
| ECUADOR | 26 |
| MOZAMBIQUE | 26 |
| LEBANON | 23 |
| GUINEA | 22 |
| SIERRA LEONE | 22 |
| LATVIA | 20 |
| SLOVAKIA | 20 |
| BARBADOS | 18 |
| GEORGIA | 18 |
| LITHUANIA | 18 |
| COSTA RICA | 17 |
| BULGARIA | 16 |
| YEMEN | 16 |
| ZIMBABWE | 16 |
| MALI | 15 |
| UKRAINE | 15 |
| CAMBODIA | 14 |
| MALTA | 13 |
| MADAGASCAR | 12 |
| MONTENEGRO | 12 |
| MYANMAR | 12 |
| BAHRAIN | 11 |
| KUWAIT | 11 |
| MALAWI | 11 |
| SENEGAL | 11 |
| URUGUAY | 11 |
| ALBANIA | 10 |
| MAURITIUS | 10 |
| BURKINA FASO | 9 |
| KAZAKHSTAN | 9 |
| ZAMBIA | 9 |
| RWANDA | 8 |
| VENEZUELA | 8 |
| ARMENIA | 7 |
| NORTH MACEDONIA | 7 |
| AZERBAIJAN | 6 |
| GABON | 6 |
| TONGA | 6 |
| CUBA | 5 |
| GAMBIA | 5 |
| MOLDOVA | 5 |
| NAMIBIA | 5 |
| BOLIVIA | 4 |
| HAITI | 4 |
| HONDURAS | 4 |
| JAMAICA | 4 |
| LESOTHO | 4 |
| NICARAGUA | 4 |
| PAPUA NEW GUINEA | 4 |
| SURINAME | 4 |
| TAJIKISTAN | 4 |
| AFGHANISTAN | 3 |
| BENIN | 3 |
| BURUNDI | 3 |
| CENTRAL AFRICAN REPUBLIC | 3 |
| DOMINICAN REPUBLIC | 3 |
| LIBERIA | 3 |
| MONGOLIA | 3 |
| SOUTH SUDAN | 3 |
| UZBEKISTAN | 3 |
| BELIZE | 2 |
| FIJI | 2 |
| GUAM | 2 |
| LIBYA | 2 |
| MAURITANIA | 2 |
| PANAMA | 2 |
| TOGO | 2 |
| EL SALVADOR | 1 |
| ERITREA | 1 |
| KYRGYZSTAN | 1 |
| SAMOA | 1 |
| SWAZILAND | 1 |
Countries’ Production over Time
Most Cited Countries
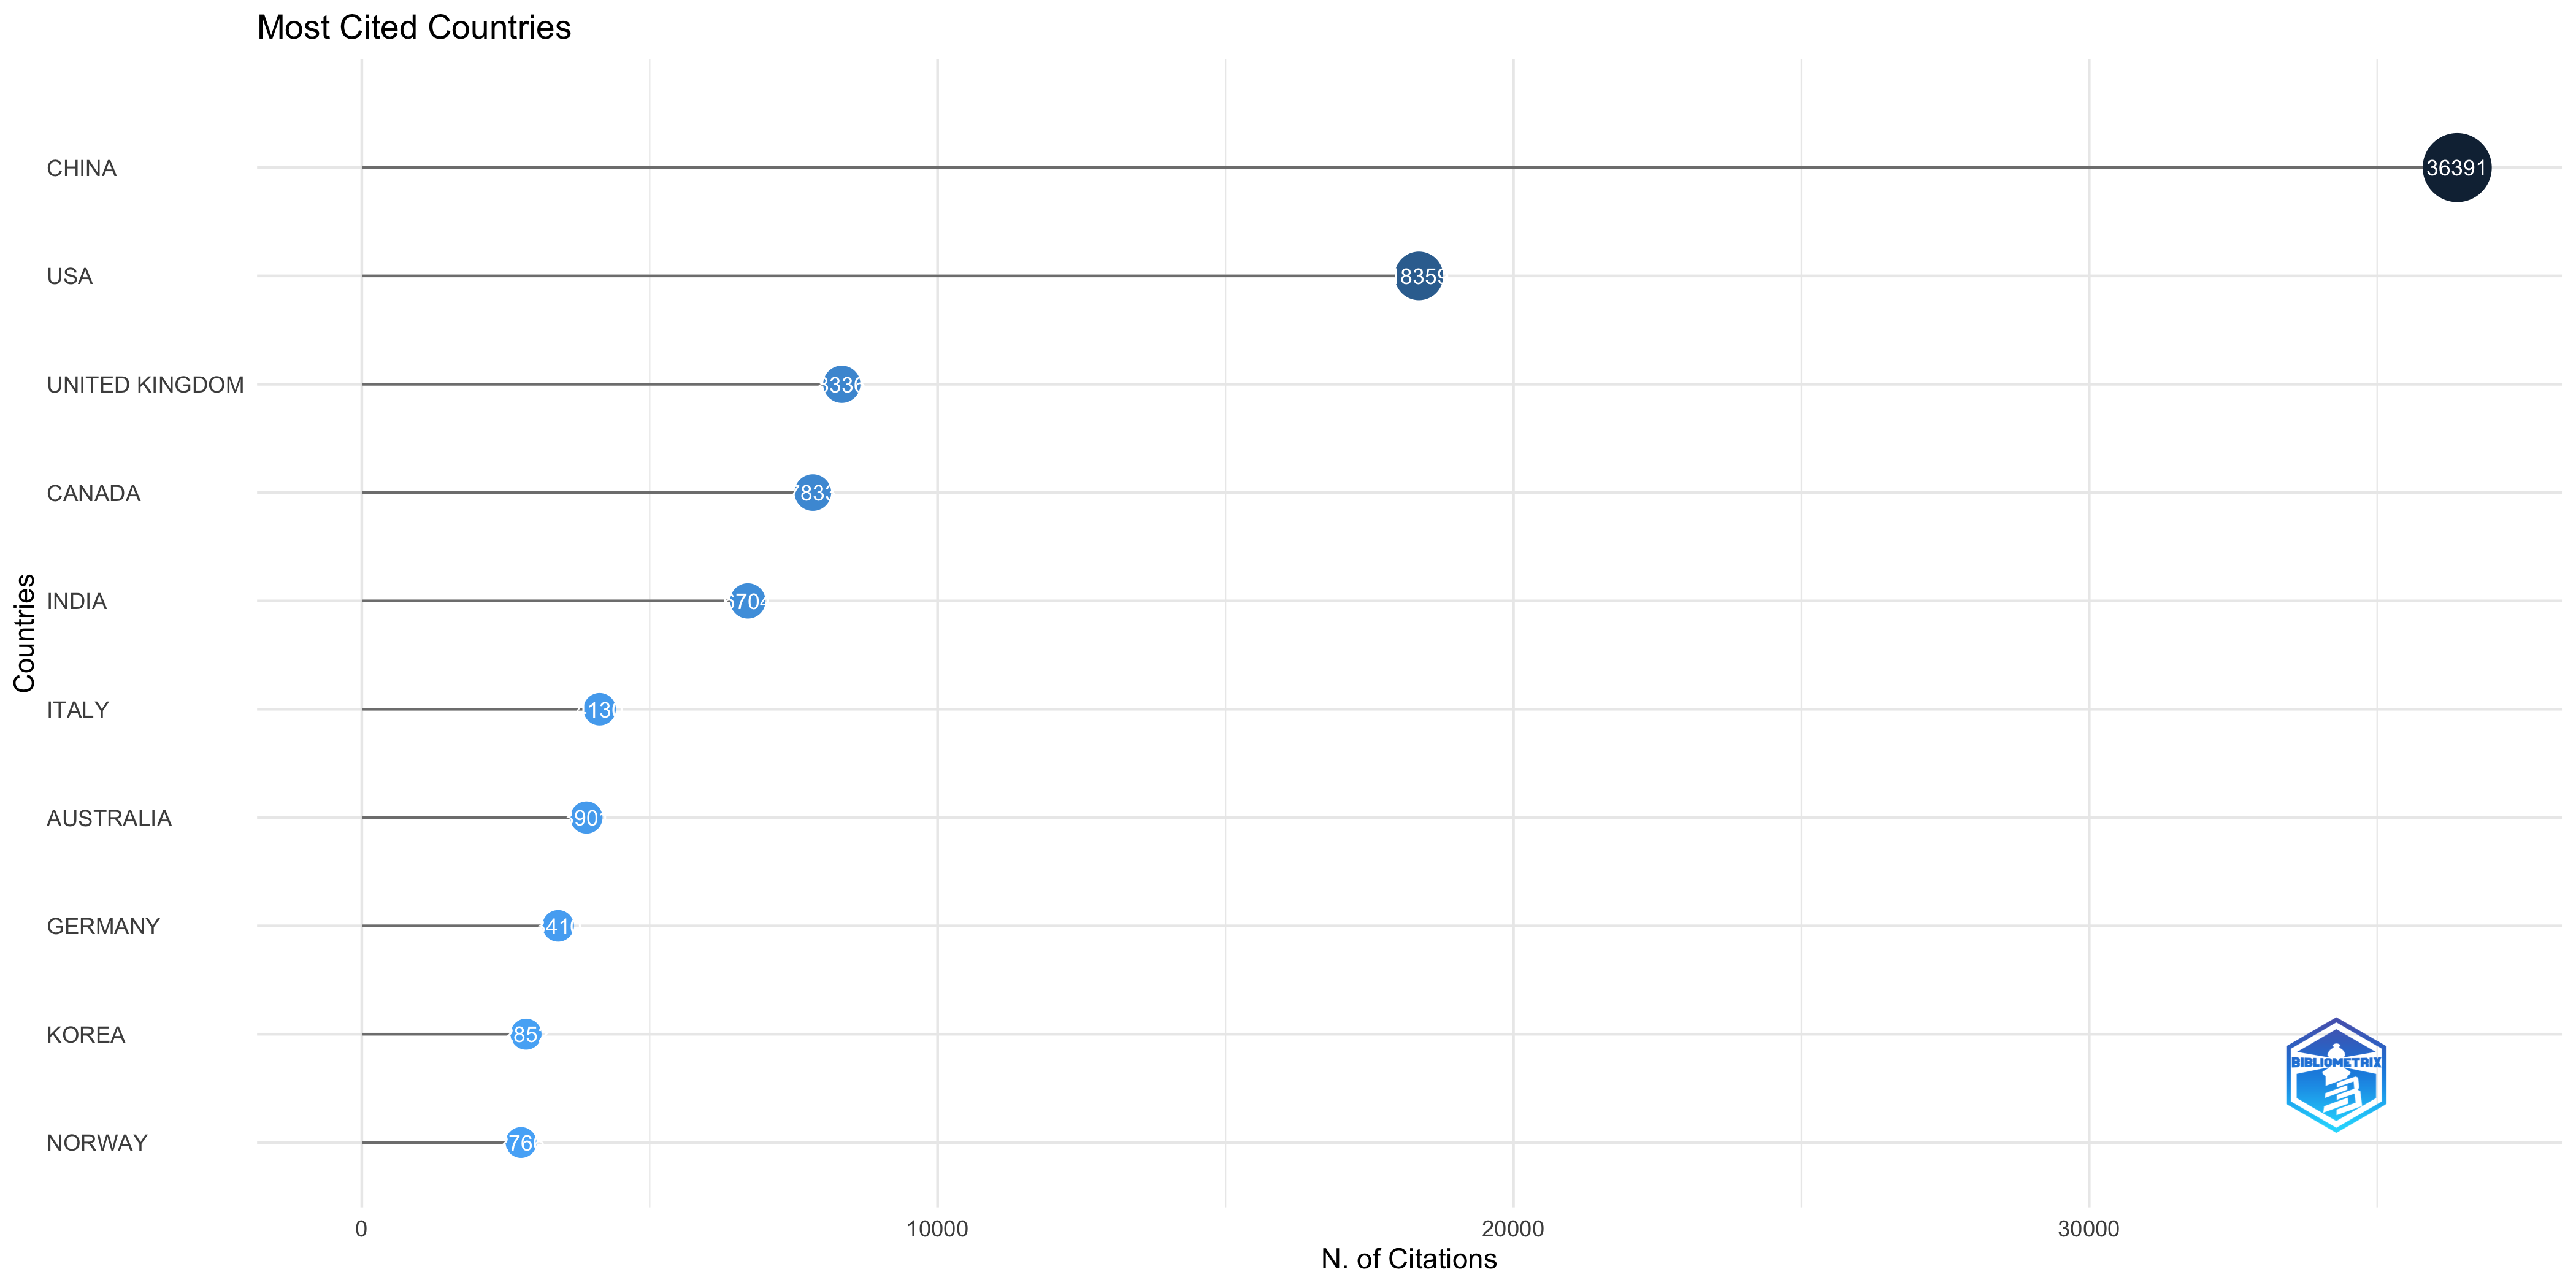
| CHINA | 36391 | 15.20 |
| USA | 18359 | 13.20 |
| UNITED KINGDOM | 8336 | 15.30 |
| CANADA | 7833 | 27.70 |
| INDIA | 6704 | 11.30 |
| ITALY | 4130 | 18.70 |
| AUSTRALIA | 3901 | 15.60 |
| GERMANY | 3410 | 11.30 |
| KOREA | 2852 | 13.60 |
| NORWAY | 2766 | 46.90 |
| NETHERLANDS | 2647 | 15.90 |
| SWITZERLAND | 1936 | 21.80 |
| SAUDI ARABIA | 1893 | 18.90 |
| JAPAN | 1709 | 15.70 |
| FRANCE | 1690 | 12.20 |
| SPAIN | 1655 | 12.40 |
| SINGAPORE | 1589 | 32.40 |
| IRELAND | 1314 | 29.20 |
| SWEDEN | 1279 | 20.60 |
| FINLAND | 1254 | 24.60 |
| HONG KONG | 1157 | 29.70 |
| IRAN | 910 | 15.20 |
| BRAZIL | 803 | 13.00 |
| PAKISTAN | 773 | 15.20 |
| BELGIUM | 672 | 9.60 |
| MALAYSIA | 668 | 11.00 |
| GEORGIA | 648 | 32.40 |
| AUSTRIA | 638 | 14.80 |
| UNITED ARAB EMIRATES | 532 | 31.30 |
| GREECE | 500 | 15.20 |
| BANGLADESH | 470 | 33.60 |
| DENMARK | 380 | 9.30 |
| POLAND | 377 | 10.50 |
| MAURITIUS | 342 | 342.00 |
| JORDAN | 337 | 18.70 |
| SOUTH AFRICA | 328 | 6.20 |
| INDONESIA | 325 | 9.80 |
| PORTUGAL | 319 | 8.20 |
| TURKEY | 302 | 6.40 |
| QATAR | 283 | 21.80 |
| EGYPT | 241 | 9.60 |
| ESTONIA | 226 | 37.70 |
| CROATIA | 220 | 18.30 |
| TUNISIA | 219 | 14.60 |
| NEW ZEALAND | 216 | 13.50 |
| CYPRUS | 204 | 29.10 |
| ISRAEL | 196 | 8.20 |
| THAILAND | 160 | 6.20 |
| IRAQ | 129 | 5.90 |
| LUXEMBOURG | 118 | 11.80 |
| ALGERIA | 104 | 10.40 |
| YEMEN | 83 | 41.50 |
| ROMANIA | 82 | 8.20 |
| CZECH REPUBLIC | 81 | 5.80 |
| MOROCCO | 78 | 5.20 |
| HUNGARY | 72 | 7.20 |
| SLOVENIA | 68 | 11.30 |
| ETHIOPIA | 63 | 7.90 |
| MEXICO | 59 | 4.90 |
| TANZANIA | 53 | 7.60 |
| GHANA | 49 | 6.10 |
| OMAN | 44 | 7.30 |
| NIGERIA | 40 | 2.40 |
| CONGO | 39 | 9.80 |
| BOTSWANA | 34 | 6.80 |
| LEBANON | 34 | 8.50 |
| ARGENTINA | 33 | 11.00 |
| KENYA | 33 | 3.00 |
| CAMBODIA | 28 | 28.00 |
| SUDAN | 27 | 13.50 |
| PHILIPPINES | 25 | 5.00 |
| UGANDA | 25 | 4.20 |
| LATVIA | 24 | 6.00 |
| SERBIA | 22 | 5.50 |
| ZAMBIA | 22 | 5.50 |
| COSTA RICA | 21 | 7.00 |
| ICELAND | 21 | 21.00 |
| SLOVAKIA | 19 | 4.80 |
| LAOS | 17 | 17.00 |
| MONTENEGRO | 16 | 5.30 |
| COLOMBIA | 15 | 5.00 |
| JAMAICA | 12 | 6.00 |
| VIETNAM | 12 | 6.00 |
| MADAGASCAR | 10 | 10.00 |
| CHAD | 8 | 8.00 |
| PALAU | 8 | 8.00 |
| CAMEROON | 6 | 3.00 |
| ZIMBABWE | 6 | 3.00 |
| BAHRAIN | 5 | 5.00 |
| NEPAL | 5 | 1.70 |
| ECUADOR | 4 | 4.00 |
| MACEDONIA | 4 | 4.00 |
| NAMIBIA | 4 | 4.00 |
| AFGHANISTAN | 3 | 3.00 |
| BULGARIA | 3 | 1.00 |
| CHILE | 3 | 1.50 |
| KAZAKHSTAN | 2 | 0.70 |
| LITHUANIA | 2 | 1.00 |
| SRI LANKA | 2 | 0.70 |
| BARBADOS | 1 | 0.30 |
| KUWAIT | 1 | 0.50 |
| UZBEKISTAN | 1 | 1.00 |
| ARMENIA | 0 | 0.00 |
| GUINEA | 0 | 0.00 |
| MALI | 0 | 0.00 |
| MALTA | 0 | 0.00 |
| PERU | 0 | 0.00 |
| RUSSIA | 0 | 0.00 |
| RWANDA | 0 | 0.00 |
| TRINIDAD AND TOBAGO | 0 | 0.00 |
| UKRAINE | 0 | 0.00 |
Most Global Cited Documents
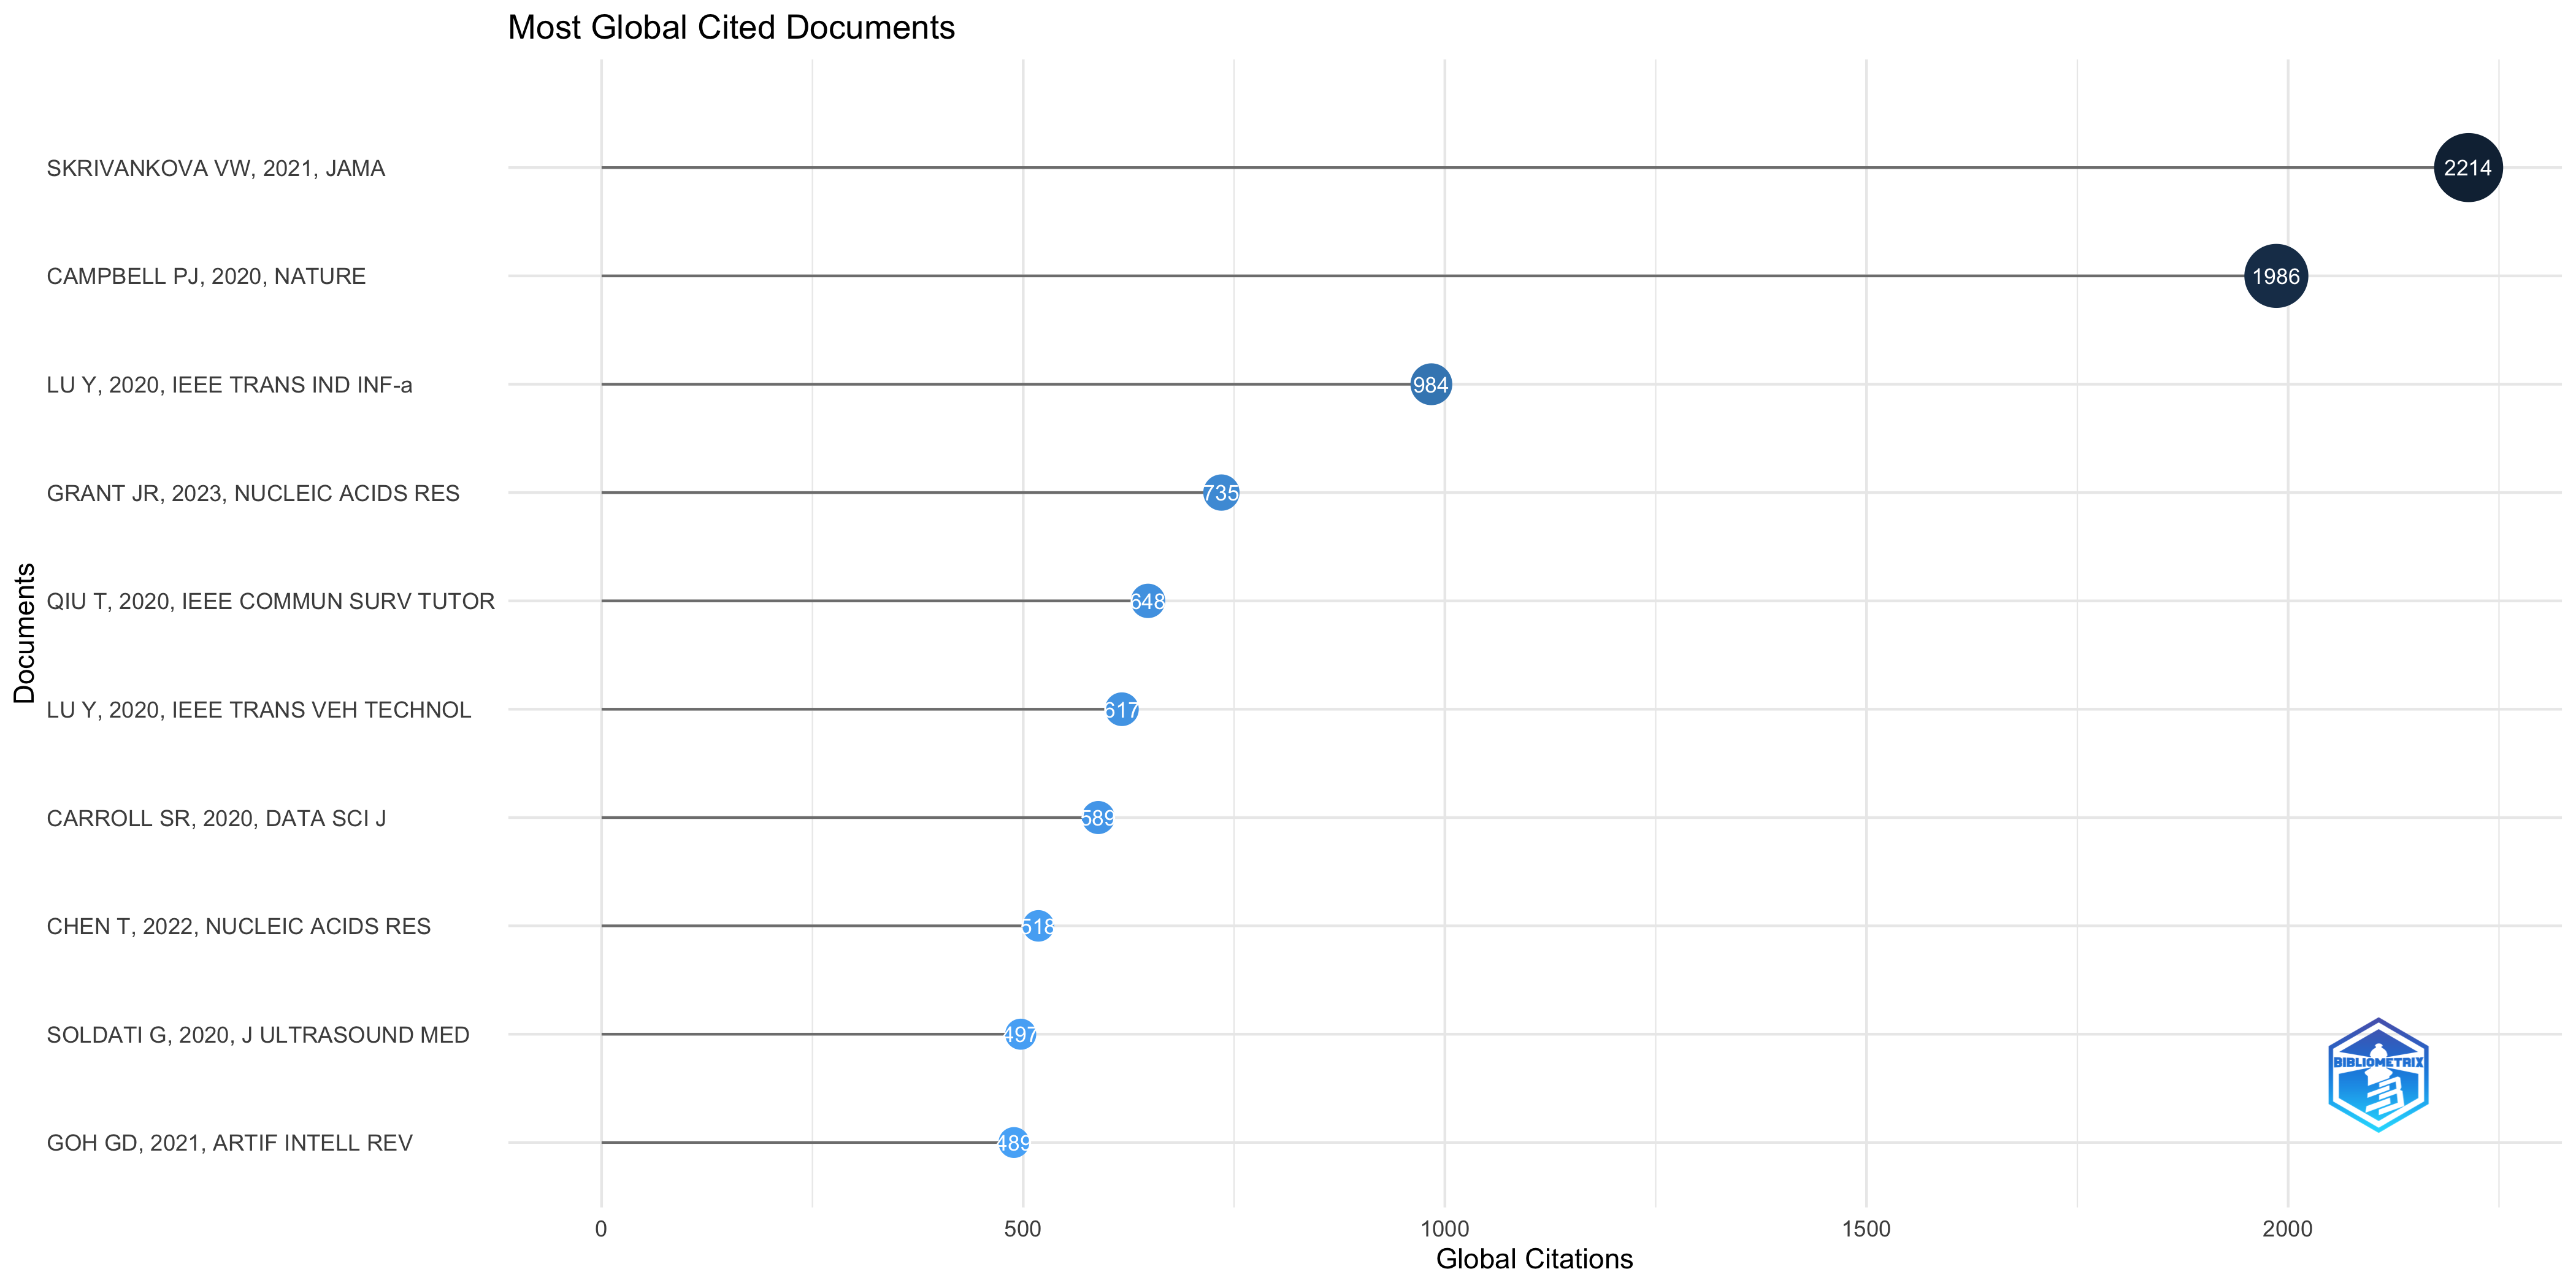
| SKRIVANKOVA VW, 2021, JAMA | 10.1001/jama.2021.18236 | 2214 | 442.80 | 80.26 |
| CAMPBELL PJ, 2020, NATURE | 10.1038/s41586-020-1969-6 | 1986 | 331.00 | 56.48 |
| LU Y, 2020, IEEE TRANS IND INF-a | 10.1109/TII.2019.2942190 | 984 | 164.00 | 27.99 |
| GRANT JR, 2023, NUCLEIC ACIDS RES | 10.1093/nar/gkad326 | 735 | 245.00 | 64.89 |
| QIU T, 2020, IEEE COMMUN SURV TUTOR | 10.1109/COMST.2020.3009103 | 648 | 108.00 | 18.43 |
| LU Y, 2020, IEEE TRANS VEH TECHNOL | 10.1109/TVT.2020.2973651 | 617 | 102.83 | 17.55 |
| CARROLL SR, 2020, DATA SCI J | 10.5334/DSJ-2020-043 | 589 | 98.17 | 16.75 |
| CHEN T, 2022, NUCLEIC ACIDS RES | 10.1093/nar/gkab1081 | 518 | 129.50 | 28.84 |
| SOLDATI G, 2020, J ULTRASOUND MED | 10.1002/jum.15285 | 497 | 82.83 | 14.14 |
| GOH GD, 2021, ARTIF INTELL REV | 10.1007/s10462-020-09876-9 | 489 | 97.80 | 17.73 |
| DAYAN I, 2021, NAT MED | 10.1038/s41591-021-01506-3 | 486 | 97.20 | 17.62 |
| NGUYEN DC, 2021, IEEE INTERNET THINGS J-a | 10.1109/JIOT.2021.3072611 | 470 | 94.00 | 17.04 |
| ZHENG X, 2020, IEEE J SEL AREAS COMMUN | 10.1109/JSAC.2020.2980802 | 423 | 70.50 | 12.03 |
| SWARNA PRIYA RM, 2020, COMPUT COMMUN | 10.1016/j.comcom.2020.05.048 | 406 | 67.67 | 11.55 |
| OBAR JA, 2020, INF COMMUN SOC | 10.1080/1369118X.2018.1486870 | 393 | 65.50 | 11.18 |
| CHENG K, 2021, IEEE INTELL SYST | 10.1109/MIS.2021.3082561 | 382 | 76.40 | 13.85 |
| DI VAIO A, 2020, INT J INF MANAGE | 10.1016/j.ijinfomgt.2019.09.010 | 378 | 63.00 | 10.75 |
| KIVIPELTO M, 2020, ALZHEIMER’S DEMENTIA | 10.1002/alz.12123 | 370 | 61.67 | 10.52 |
| HUYNH-THE T, 2023, FUTURE GENER COMPUT SYST | 10.1016/j.future.2023.02.008 | 368 | 122.67 | 32.49 |
| XIE Y, 2020, EARTHQUAKE SPECTRA | 10.1177/8755293020919419 | 364 | 60.67 | 10.35 |
| KHATOON A, 2020, ELECTRONICS (SWITZERLAND) | 10.3390/electronics9010094 | 362 | 60.33 | 10.30 |
| KUMAR R, 2021, IEEE SENSORS J | 10.1109/JSEN.2021.3076767 | 362 | 72.40 | 13.12 |
| SAVAZZI S, 2020, IEEE INTERNET THINGS J | 10.1109/JIOT.2020.2964162 | 347 | 57.83 | 9.87 |
| LU Y, 2020, IEEE TRANS IND INF | 10.1109/TII.2019.2942179 | 343 | 57.17 | 9.76 |
| ALLAM Z, 2020, HEALTHCARE (BASEL) | 10.3390/healthcare8010046 | 342 | 57.00 | 9.73 |
Most Local Cited Documents
Overall Observations:
- IEEE Journals Dominate: A significant portion of the top locally cited articles are published in IEEE journals, particularly those focused on Industrial Informatics, Vehicle Technology, and Internet of Things. This strongly suggests that your dataset is heavily focused on these engineering and technology fields. This might be intentional, or it might be a bias in your search strategy that needs to be considered.
- Recent Publications: The majority of the articles are from 2020, 2021 and 2022. This indicates a relatively recent burst of activity and interest within the research area covered by your dataset. This recency also explains why the global citation counts might be lower than expected for some of the articles with high local citation counts; they simply haven’t had as much time to accrue citations globally.
- Normalization is Key: The NLC and NGC values are critical for comparing articles across different years. Without normalization, older articles would inherently have an advantage in citation counts.
Identifying Articles with Different Types of Impact:
Let’s categorize the articles based on their LC, GC, NLC, and NGC values to identify those with different types of influence:
* High Local and Global Impact (Potential Core Articles): These articles are influential both within your specific research area and in the broader scientific community. Look for articles with both high LC and GC, as well as high NLC and NGC.
* LU Y, 2020, IEEE TRANS IND INF: This article stands out significantly with high LC (74) and GC (984), and the highest NLC (61.75) indicating exceptional local relevance, and a substantial NGC (27.99), suggesting a broad impact.
* DAYAN I, 2021, NAT MED: While its LC (36) is moderate compared to the top, its GC (486) is substantial. Its NGC (17.62) is relatively high, suggesting a strong influence on the field, despite being published in a journal outside the core IEEE focus.
* NGUYEN DC, 2021, IEEE INTERNET THINGS J-a: LC 30, GC 470, NLC 41.2, NGC 17.04; A strong article globally and relevant locally.
* High Local Impact, Moderate Global Impact (Specialized Relevance): These articles are highly relevant to the specific research area defined by your dataset, but their influence might be more limited in the broader scientific context. They could be focused on niche topics or methodologies particularly important within the field. Look for high LC and NLC, but moderate GC and NGC.
* YU K, 2021, IEEE TRANS IND INF: It has a relatively high LC (47) and NLC (64.54) showing its importance within the specific field. However, its GC (288) and NGC (10.44) are moderate compared to the top performers.
* KALKMAN S, 2022, J MED ETHICS: This article’s appearance is unexpected given the dominance of IEEE journals. Its LC (40) and NLC (52.5) suggest relevance within the dataset, but the more moderate GC (174) and NGC (9.69) indicate a narrower global impact.
* Moderate Local Impact, High Global Impact (Broadly Influential): These articles might not be the most frequently cited within your specific dataset, but they have had a significant impact on the broader scientific community. They might cover foundational concepts or methodologies that are widely used across different fields. Look for moderate LC and NLC, but high GC and NGC.
* KUMAR R, 2021, IEEE SENSORS J: moderate LC (27) but GC (362) with good normalized metrics.
* ZHENG X, 2020, IEEE J SEL AREAS COMMUN: LC 32, GC 423, NLC 26.7, NGC 12.03; another example with relatively strong global influence.
* Emerging Trends: Articles from 2022 could represent emerging trends. While their overall citation counts might be lower due to their recent publication date, their high local citation counts suggest that they are gaining traction within the field.
Critical Discussion Points & Further Investigation:
- Dataset Scope: Carefully consider the search terms and inclusion criteria used to create your Scopus dataset. The dominance of IEEE journals suggests a strong bias towards engineering and technology. Are you capturing all relevant research, or are you missing important contributions from other disciplines?
- Citation Context: While citation counts provide a quantitative measure of impact, it’s important to consider the context in which these articles are being cited. Are they being cited for their innovative contributions, or are they being criticized or used as a point of comparison? A qualitative analysis of the citing articles can provide valuable insights.
- Interdisciplinary Connections: The presence of articles from *Nature Medicine* and *Journal of Medical Ethics* suggests potential interdisciplinary connections. Explore the content of these articles and identify the specific topics or methodologies that are relevant to the core research area covered by your dataset.
- Impact of Normalization: Pay close attention to the NLC and NGC values when comparing articles from different years. Normalization helps to account for the increasing number of publications and citations over time, allowing for a more fair comparison of impact.
- Missing Articles: Are there articles *you* expected to see on this list that are missing? This could indicate gaps in your dataset or highlight articles that are influential but not necessarily highly cited.
- Journal Impact Factors: While citation counts are important, consider the impact factors of the journals in which the articles are published. Publication in a high-impact journal can increase the visibility and influence of an article. However, don’t rely solely on journal impact factors; the actual citation counts and the context in which the articles are cited are more important.
Next Steps:
1. Examine the Full List: Analyze the complete list of locally cited articles (not just the top 20) to identify additional patterns and trends.
2. Content Analysis: Read the abstracts (and potentially the full text) of the most influential articles to understand their key contributions and methodologies.
3. Citation Network Analysis: Use bibliometric tools to visualize the citation relationships between the articles in your dataset. This can help you to identify key clusters of research and influential articles that bridge different areas of the field.
4. Keyword Analysis: Perform a keyword analysis of the titles and abstracts of the most cited articles to identify the main topics and themes within the research area.
By combining quantitative bibliometric analysis with qualitative assessment of the content and context of the articles, you can gain a deeper understanding of the research landscape and identify the most influential and relevant contributions to your field. Let me know if you’d like to explore any of these next steps in more detail!
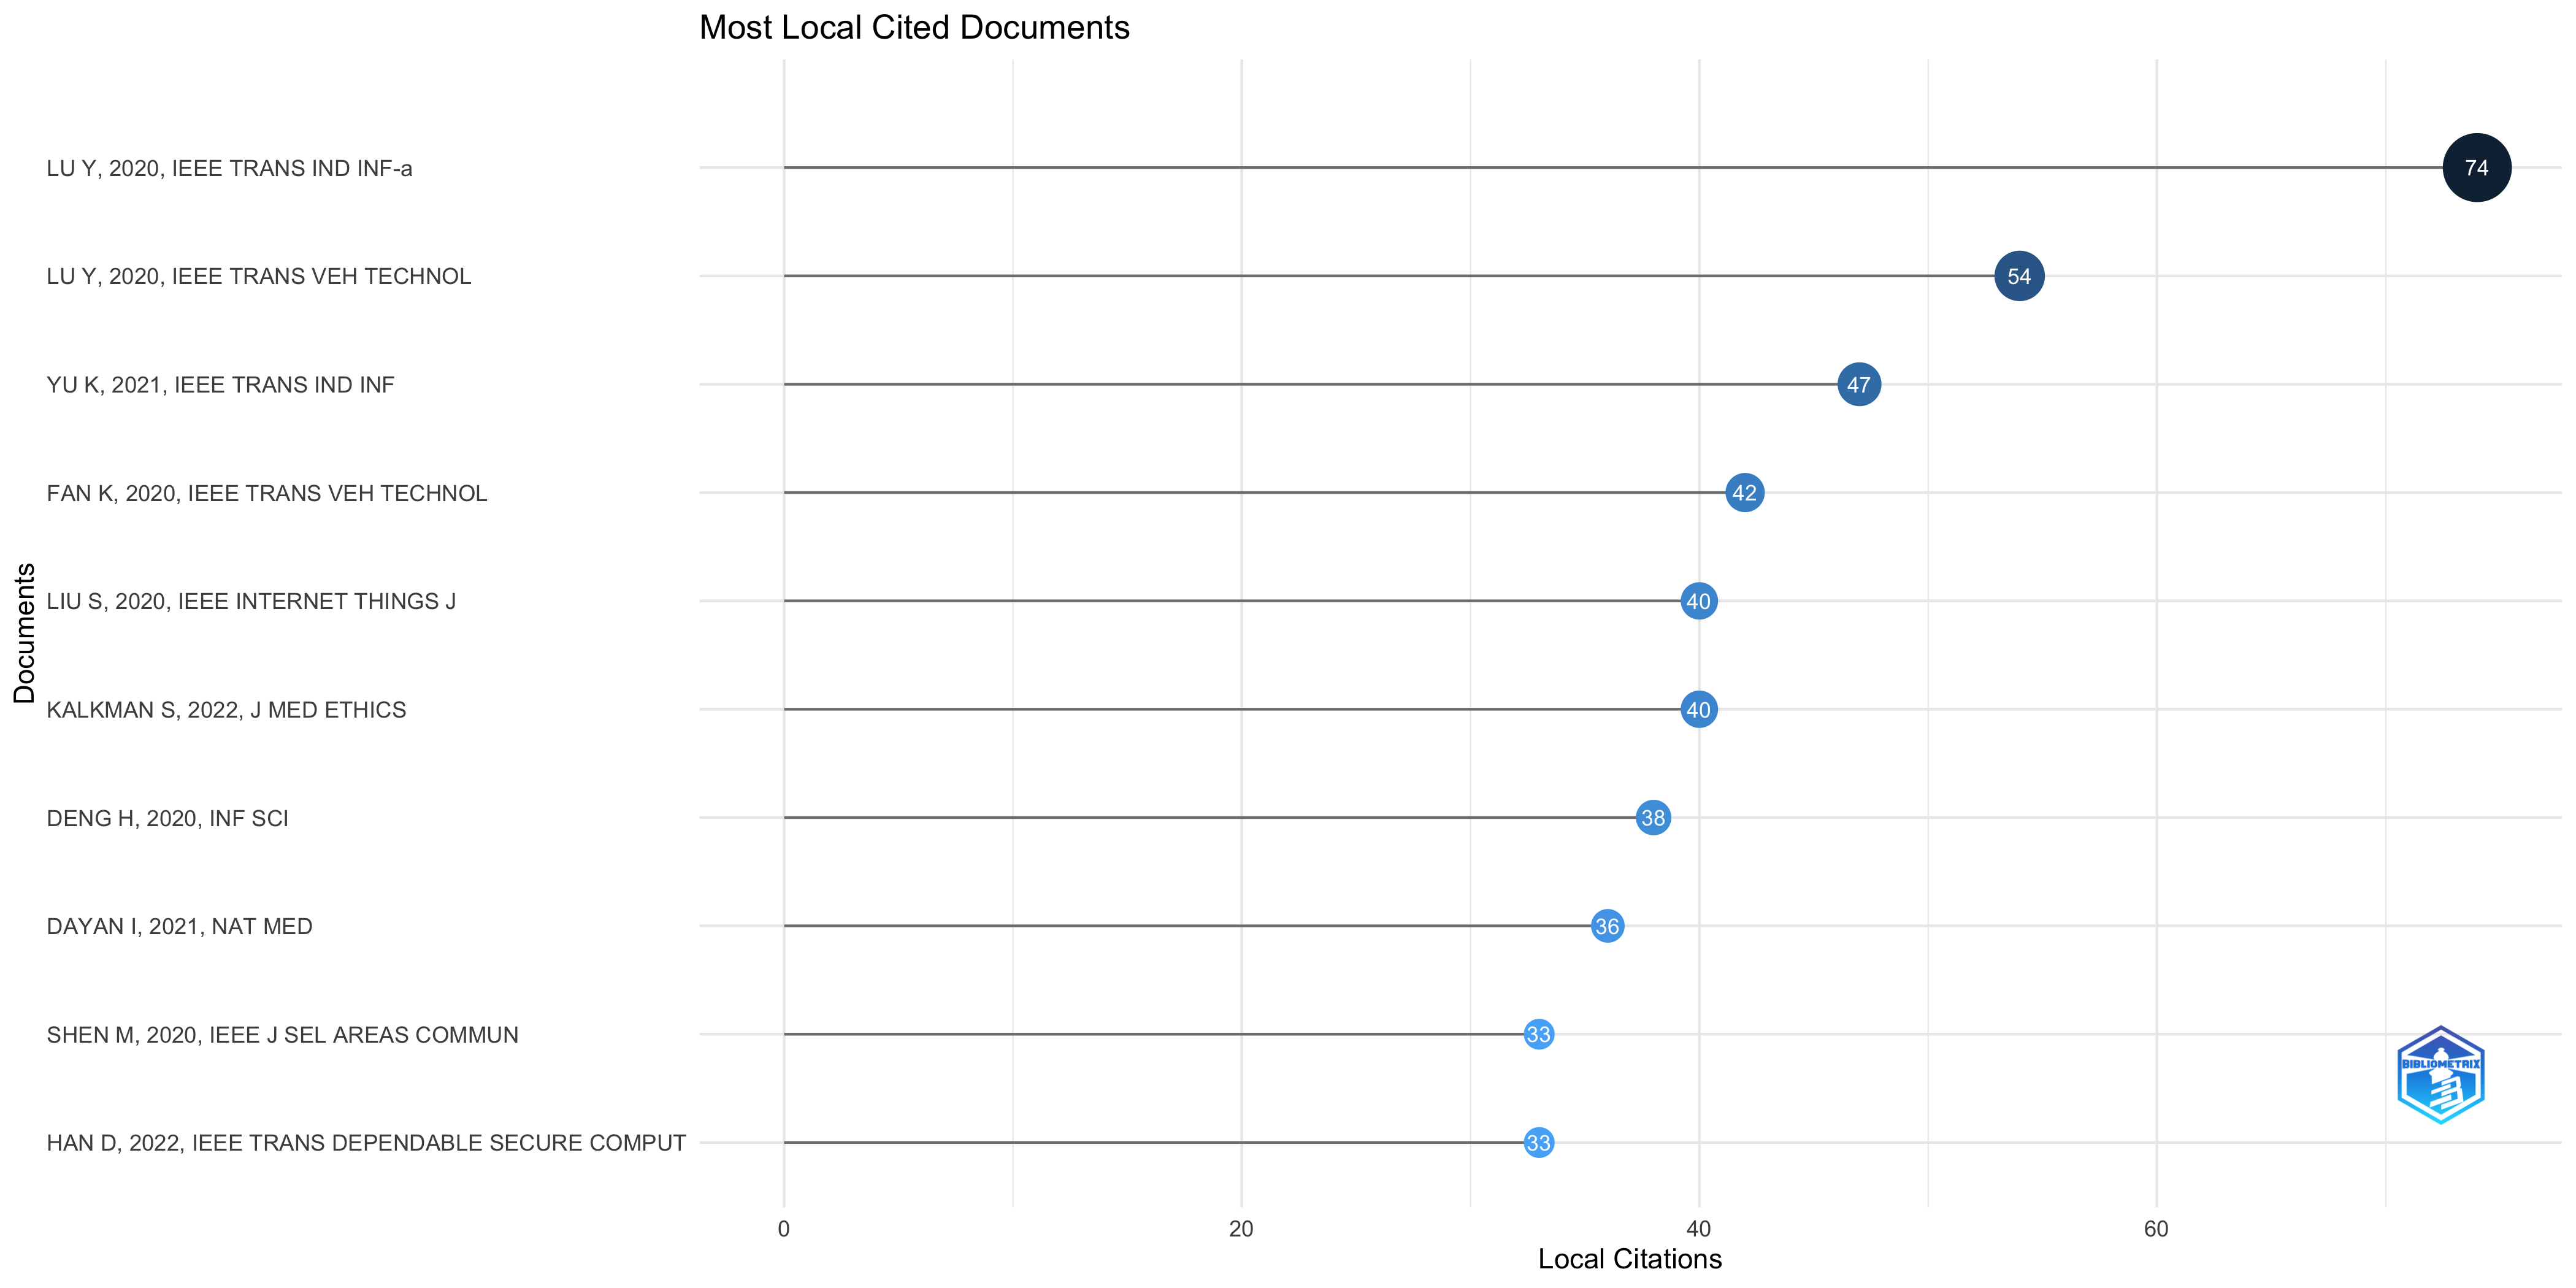
| LU Y, 2020, IEEE TRANS IND INF-a | 10.1109/TII.2019.2942190 | 2020 | 74 | 984 | 7.52 | 61.75 | 27.99 |
| LU Y, 2020, IEEE TRANS VEH TECHNOL | 10.1109/TVT.2020.2973651 | 2020 | 54 | 617 | 8.75 | 45.06 | 17.55 |
| YU K, 2021, IEEE TRANS IND INF | 10.1109/TII.2021.3049141 | 2021 | 47 | 288 | 16.32 | 64.54 | 10.44 |
| FAN K, 2020, IEEE TRANS VEH TECHNOL | 10.1109/TVT.2020.2968094 | 2020 | 42 | 154 | 27.27 | 35.04 | 4.38 |
| LIU S, 2020, IEEE INTERNET THINGS J | 10.1109/JIOT.2020.2993231 | 2020 | 40 | 132 | 30.30 | 33.38 | 3.75 |
| KALKMAN S, 2022, J MED ETHICS | 10.1136/medethics-2019-105651 | 2022 | 40 | 174 | 22.99 | 52.50 | 9.69 |
| DENG H, 2020, INF SCI | 10.1016/j.ins.2019.09.052 | 2020 | 38 | 92 | 41.30 | 31.71 | 2.62 |
| DAYAN I, 2021, NAT MED | 10.1038/s41591-021-01506-3 | 2021 | 36 | 486 | 7.41 | 49.44 | 17.62 |
| SHEN M, 2020, IEEE J SEL AREAS COMMUN | 10.1109/JSAC.2020.2986619 | 2020 | 33 | 137 | 24.09 | 27.54 | 3.90 |
| HAN D, 2022, IEEE TRANS DEPENDABLE SECURE COMPUT | 10.1109/TDSC.2020.2977646 | 2022 | 33 | 212 | 15.57 | 43.31 | 11.80 |
Most Local Cited References
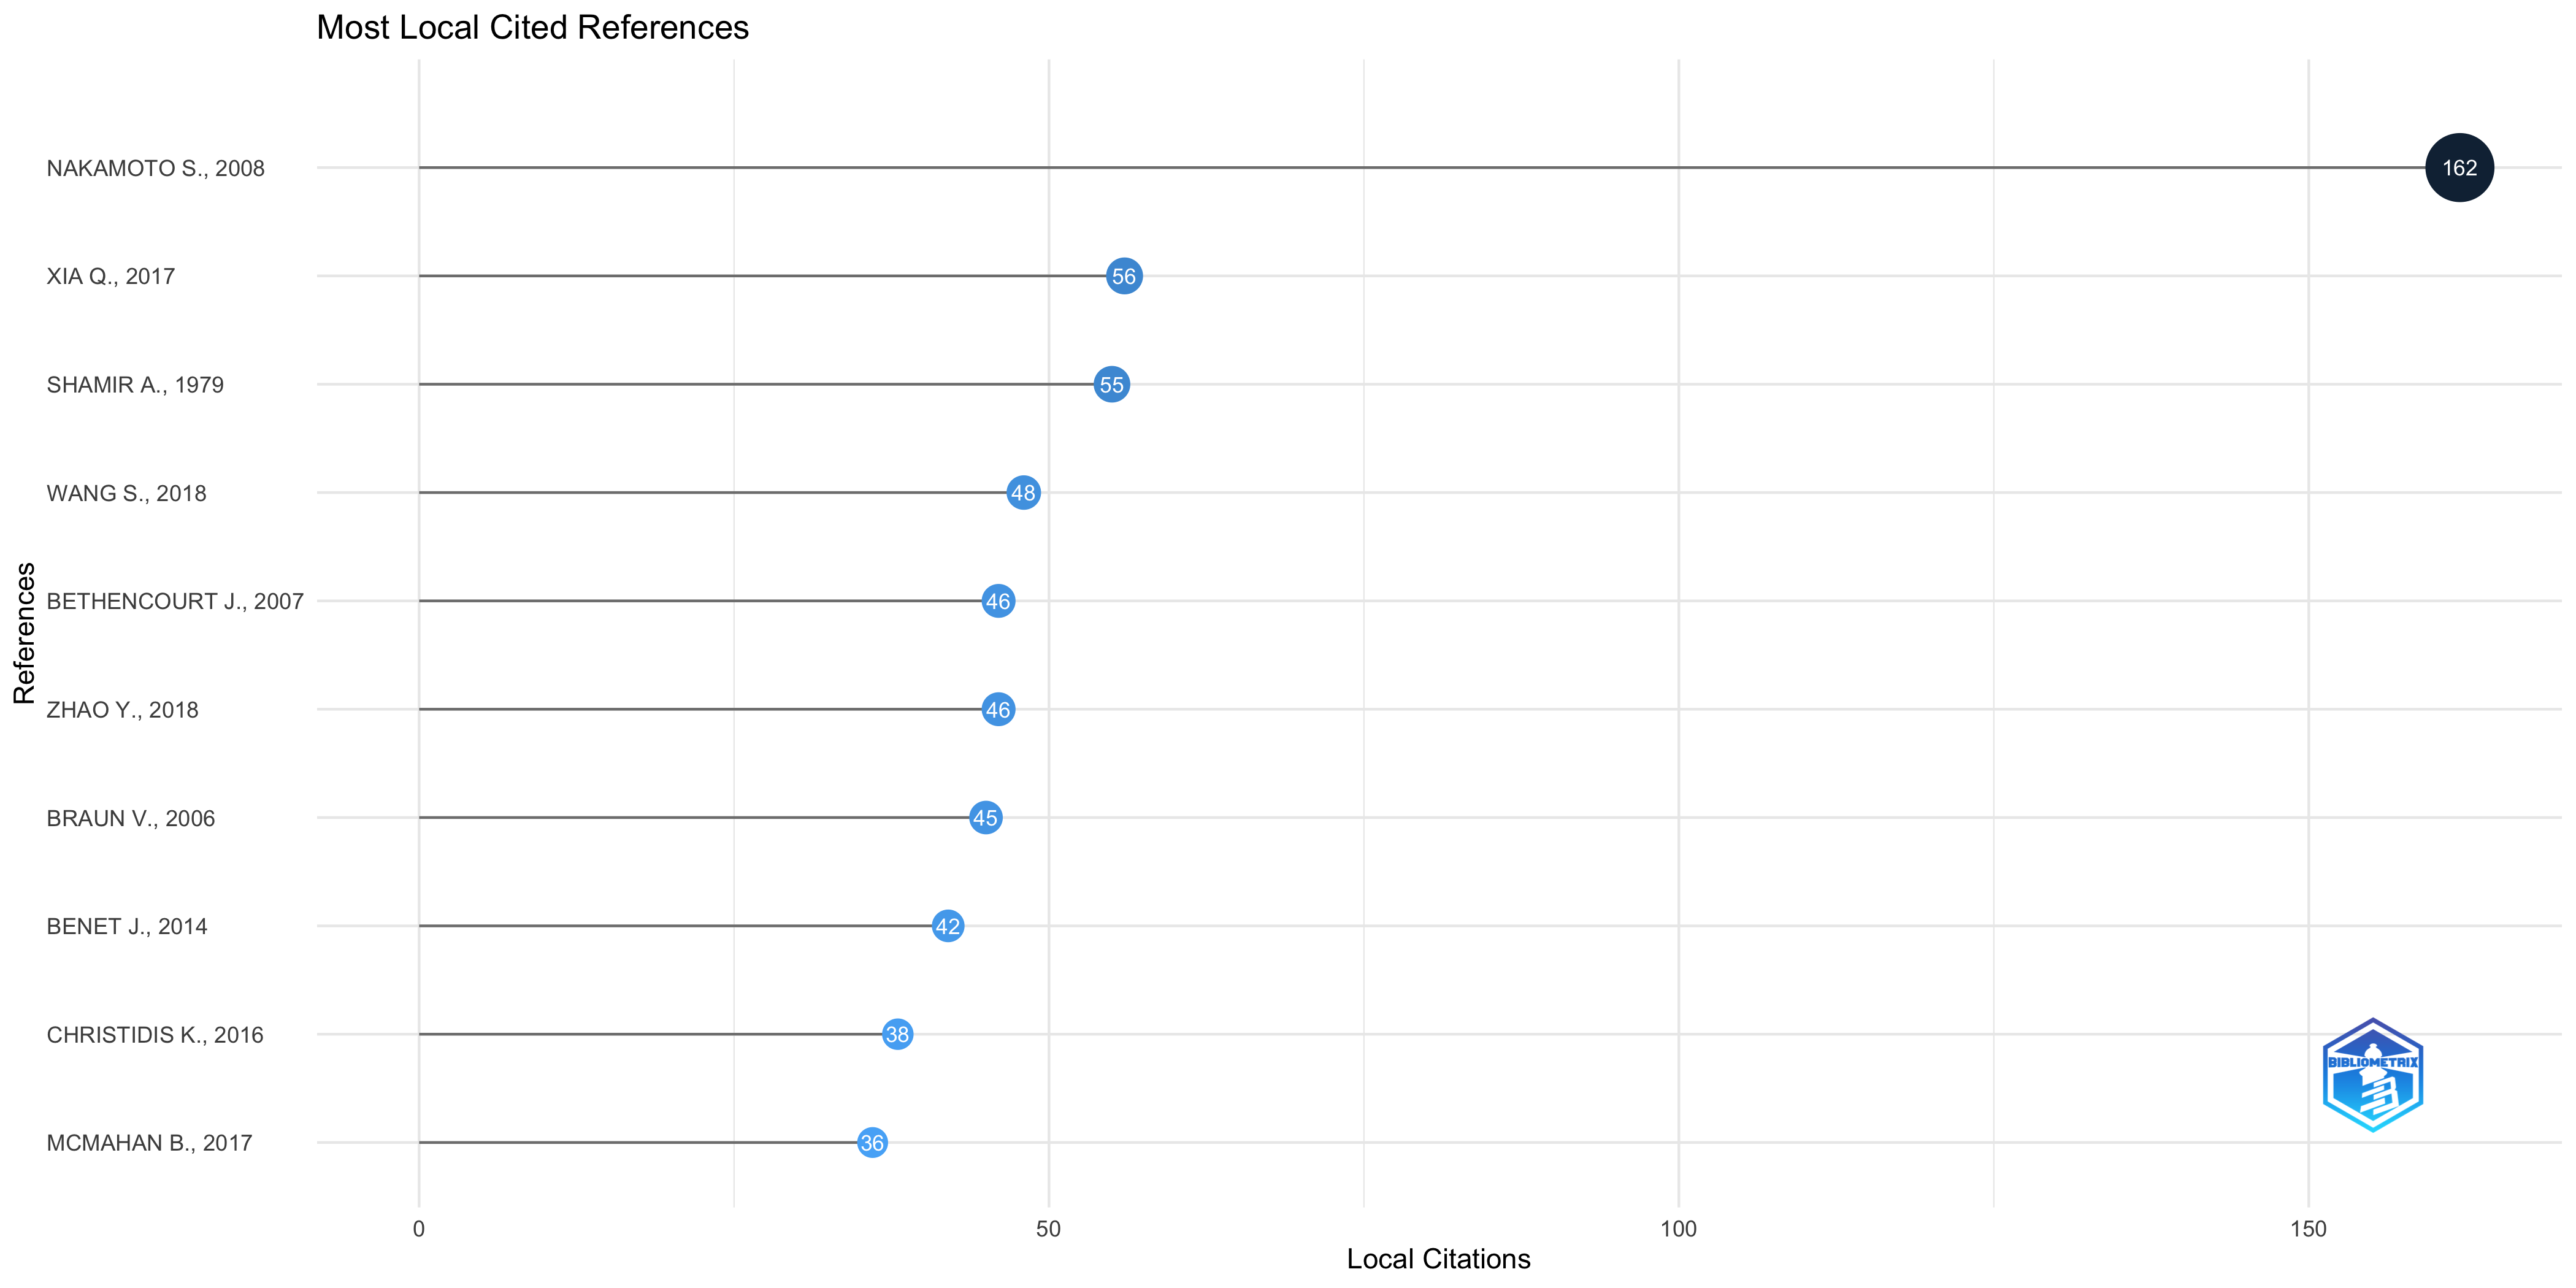
| link | NAKAMOTO S., BITCOIN: A PEER-TO-PEER ELECTRONIC CASH SYSTEM, (2008) | 162 |
| link | XIA Q., SIFAH E.B., ASAMOAH K.O., GAO J., DU X., GUIZANI M., MEDSHARE: TRUST-LESS MEDICAL DATA SHARING AMONG CLOUD SERVICE PROVIDERS VIA BLOCKCHAIN, IEEE ACCESS, 5, PP. 14757-14767, (2017) | 56 |
| link | SHAMIR A., HOW TO SHARE A SECRET, COMMUN. ACM, 22, 11, PP. 612-613, (1979) | 55 |
| link | WANG S., ZHANG Y., ZHANG Y., A BLOCKCHAIN-BASED FRAMEWORK FOR DATA SHARING WITH FINE-GRAINED ACCESS CONTROL IN DECENTRALIZED STORAGE SYSTEMS, IEEE ACCESS, 6, PP. 38437-38450, (2018) | 48 |
| link | BETHENCOURT J., SAHAI A., WATERS B., CIPHERTEXT-POLICY ATTRIBUTE-BASED ENCRYPTION, PROC. IEEE SYMP. SECUR. PRIVACY, PP. 321-334, (2007) | 46 |
| link | ZHAO Y., LI M., LAI L., SUDA N., CIVIN D., CHANDRA V., FEDERATED LEARNING WITH NON-IID DATA, (2018) | 46 |
| link | BRAUN V., CLARKE V., USING THEMATIC ANALYSIS IN PSYCHOLOGY, QUALITATIVE RESEARCH IN PSYCHOLOGY, 3, 2, PP. 77-101, (2006) | 45 |
| link | BENET J., IPFS-CONTENT ADDRESSED, VERSIONED, P2P FILE SYSTEM, (2014) | 42 |
| link | CHRISTIDIS K., DEVETSIKIOTIS M., BLOCKCHAINS AND SMART CONTRACTS FOR THE INTERNET OF THINGS, IEEE ACCESS, 4, PP. 2292-2303, (2016) | 38 |
| link | MCMAHAN B., MOORE E., RAMAGE D., HAMPSON S., Y ARCAS B.A., COMMUNICATION-EFFICIENT LEARNING OF DEEP NETWORKS FROM DECENTRALIZED DATA, ARTIFICIAL INTELLIGENCE AND STATISTICS, PP. 1273-1282, (2017) | 36 |
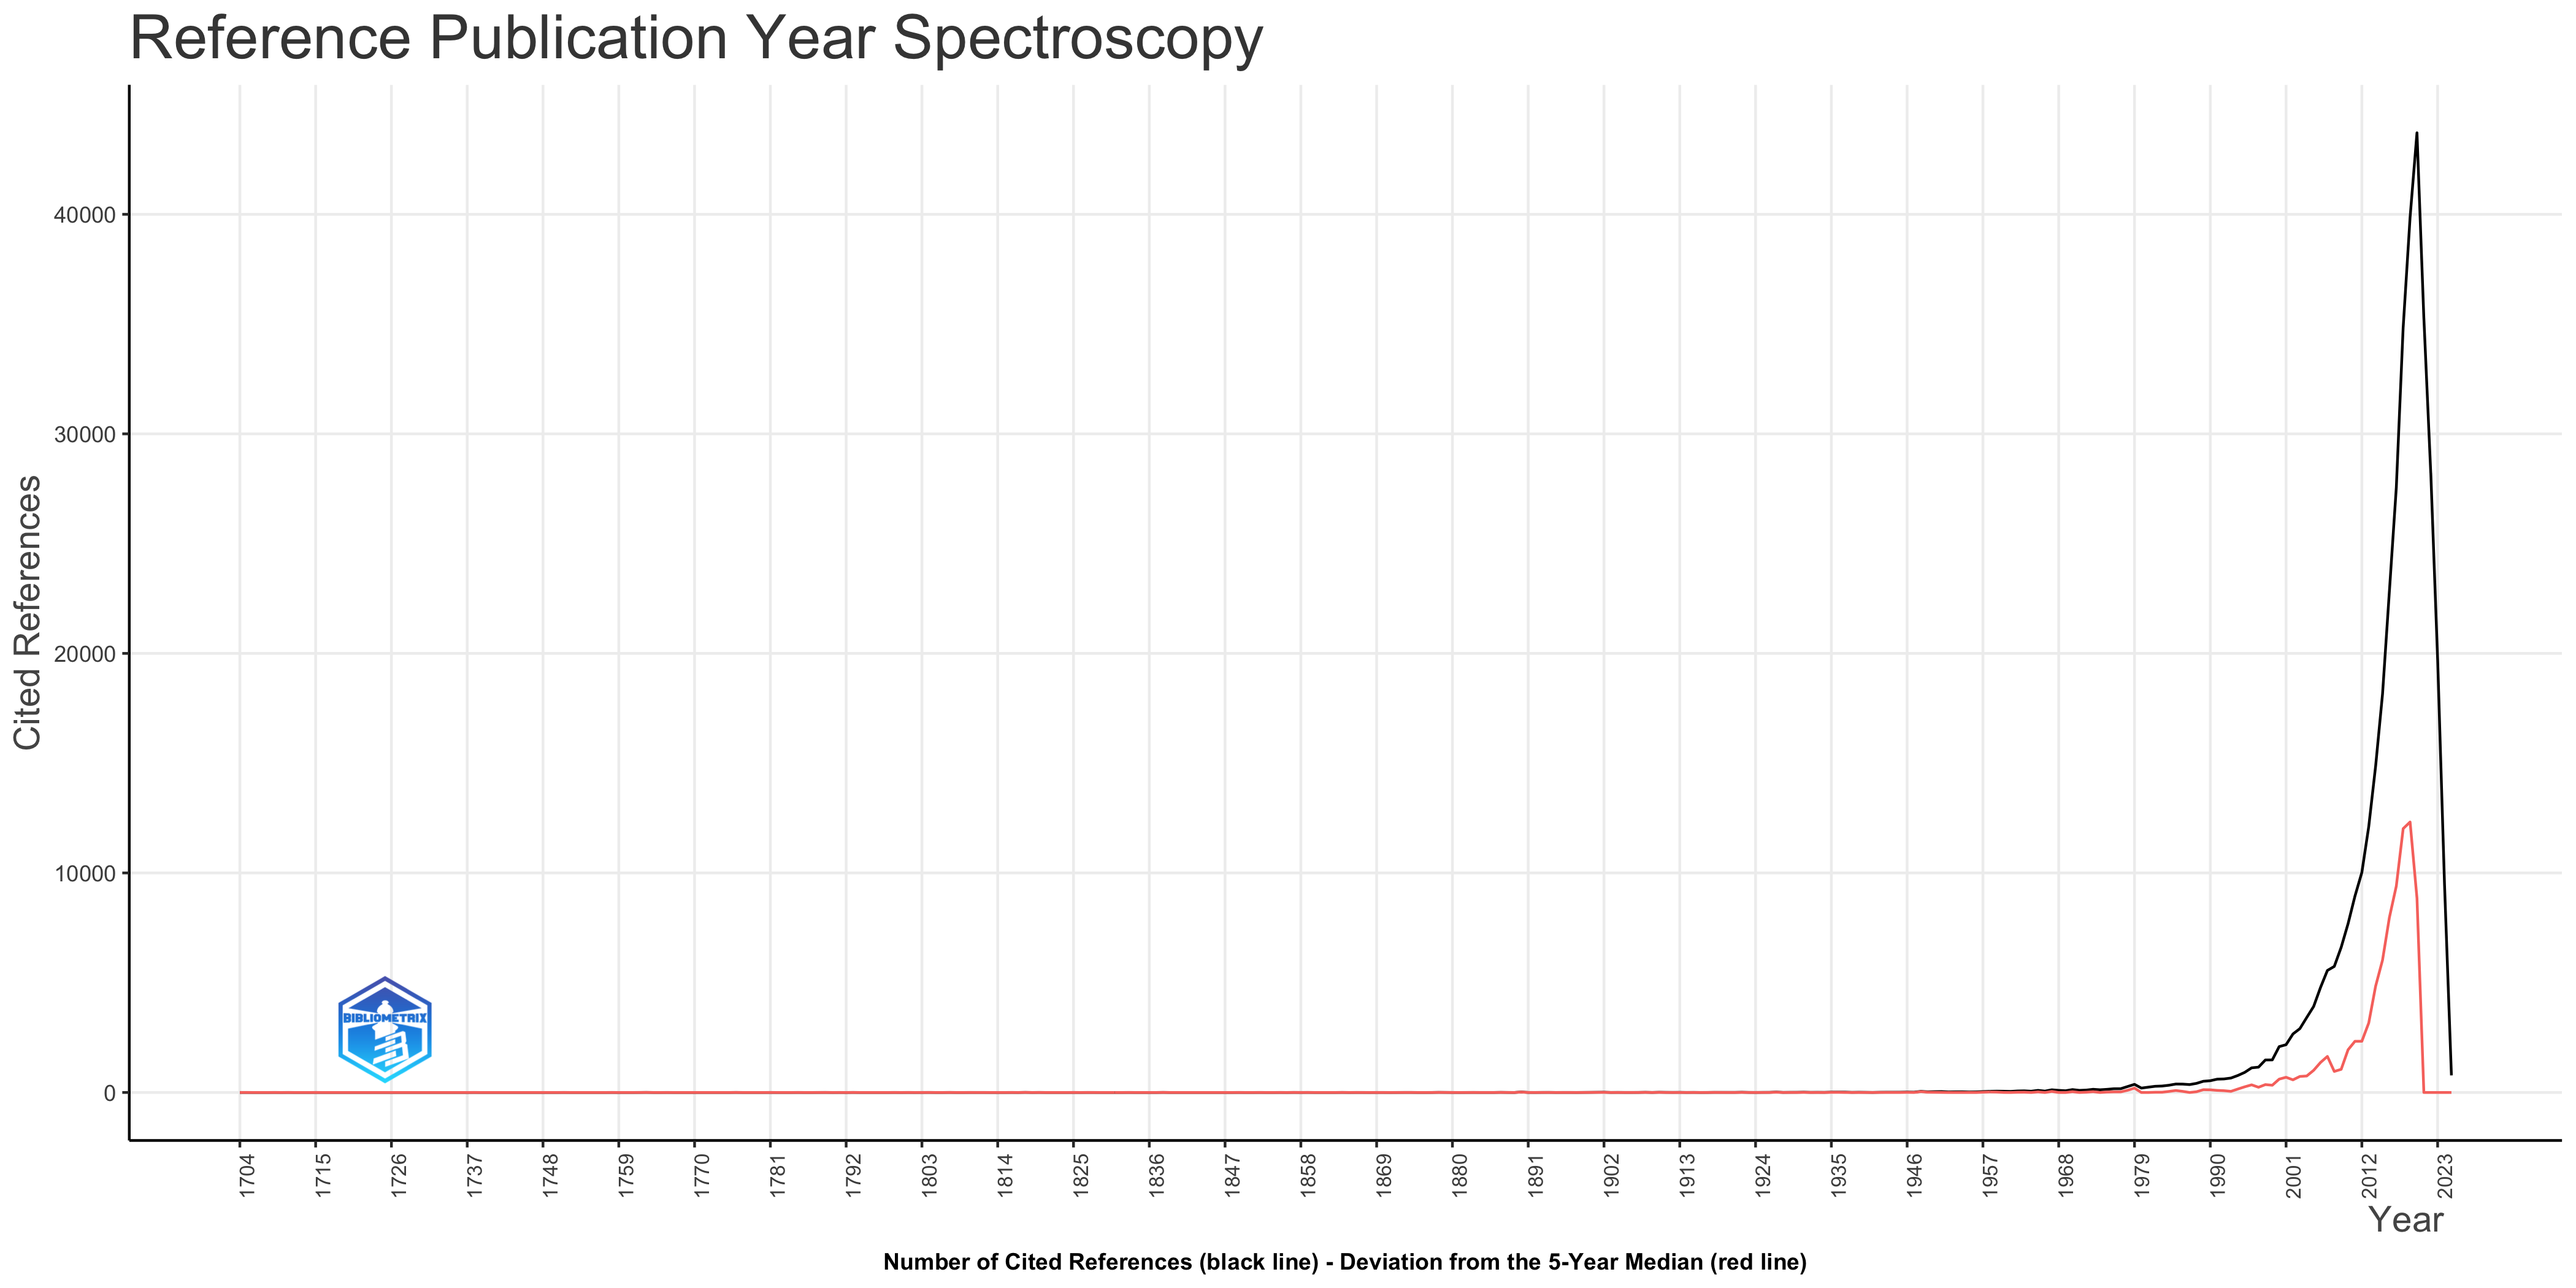
Reference Spectroscopy
Overall Interpretation of the Plot
The RPYS plot visualizes the historical roots of the research area represented by your SCOPUS dataset. The black line illustrates the total number of cited references for each publication year. A steep upward trend in the black line towards the later years suggests a rapid expansion of the research field, relying heavily on recent literature.
The red line is crucial. It highlights the “citation classics,” years when publications appeared that had a disproportionately large impact on subsequent research. The red line measures the deviation from the 5-year median citation frequency. In simpler terms, it shows when the citation count for a particular year is much higher than what would be expected based on the preceding five years. Higher peaks in the red line represent key historical “hot spots” or foundational years.
Analysis of Peak Years and Key References
Now, let’s look at the specific peak years and associated references. The list provided helps pinpoint seminal works that have shaped the field.
- 1948: The dominant entry is Claude Shannon’s “A Mathematical Theory of Communication.” This is a *major* foundational work, marking the birth of information theory. Its appearance here suggests that the research area significantly relies on concepts of information, entropy, and signal processing, even if indirectly. The presence of “Universal Declaration of Human Rights” suggests some connection to ethical or legal aspects related to information, privacy, or technology’s impact on society.
- 1967: The prominent reference is Glaser and Strauss’s “The Discovery of Grounded Theory.” Its presence suggests a methodological influence, indicating that qualitative research approaches, particularly grounded theory, are used within this research area. The inclusion of Westin’s “Privacy and Freedom” reinforces concerns about privacy.
- 1979: Adi Shamir’s “How to Share a Secret” appears repeatedly. This signifies the importance of cryptography and secure communication within the research domain. Specifically, secret sharing schemes seem to be a relevant area.
- 1985: ElGamal’s work on public-key cryptosystems is central. This further confirms the significance of cryptography and security, focusing on public-key infrastructure and its related concepts. Lincoln and Guba’s “Naturalistic Inquiry” further reinforces the methodological influence of qualitative research.
- 1989: The prevalence of Davis et al. (“Perceived Usefulness, Perceived Ease of Use, and User Acceptance of Information Technology” and related works) indicates a focus on the Technology Acceptance Model (TAM). This suggests a concern with understanding how users adopt and interact with technologies developed within this research area. Eisenhardt’s work on building theories from case studies highlights a methodological approach used in the field.
- 1996: Beimel’s work on secure schemes for secret sharing and key distribution underscores continued research on cryptography and security.
- 1998: LeCun et al.’s paper on gradient-based learning signifies the rise of neural networks and deep learning as relevant techniques. Samarati and Sweeney’s paper on k-anonymity highlights the emerging field of privacy-preserving data mining and the increasing importance of data privacy in the context of information disclosure. Blaze et al.’s work on divertible protocols and atomic proxy cryptography further indicates the importance of cryptographic techniques.
- 2001: Breiman’s “Random Forests” paper clearly demonstrates the importance of machine learning methods, particularly ensemble methods, in this research area. Boneh and Franklin’s work on identity-based encryption reinforces the importance of advanced cryptography techniques.
- 2007: Bethencourt et al.’s paper on ciphertext-policy attribute-based encryption indicates continued research on cryptographic techniques, particularly those related to access control and data security in cloud environments. The Piwowar et al. paper suggests an interest in open science and the impact of data sharing on research visibility.
- 2019: The inclusion of papers on blockchain and federated machine learning reflects the recent trends and emerging technologies being integrated into the research area. These works indicate a focus on secure data sharing, edge computing, and privacy-preserving machine learning.
Synthesis and Potential Research Directions
Based on this analysis, here’s a possible synthesis:
The research area appears to be significantly influenced by:
- Information Theory and Communication: Shannon’s work lays the groundwork.
- Cryptography and Security: Secret sharing, public-key cryptography, and advanced encryption techniques (attribute-based encryption, identity-based encryption) are central.
- Machine Learning: Random forests and deep learning are prominent.
- Privacy: Concerns about data privacy and privacy-preserving techniques (k-anonymity) are evident.
- User Acceptance: Understanding how users adopt and interact with technology is important (TAM).
- Emerging Technologies: Blockchain and federated machine learning are being explored.
- Methodology: Grounded theory and case study research are used.
This suggests the research area might be related to secure information sharing, privacy-preserving data analysis, or the development of secure and user-friendly systems.
Suggestions for Further Exploration and Critical Discussion
1. Database Bias: The analysis is based on SCOPUS data. Consider how this might bias the results. Is SCOPUS comprehensive in the relevant disciplines, or are there key journals or conferences not well-represented? Repeating the analysis with Web of Science or Google Scholar could provide a more complete picture.
2. Citation Context: RPYS only tells you *that* a paper is cited, not *how* it’s cited. A paper might be cited negatively (e.g., to critique it). A qualitative analysis of a sample of citing papers could reveal more nuanced relationships.
3. Missing Pieces: What’s *not* on the list of key references? Are there any surprising omissions? This could highlight areas that are less central than you might expect.
4. Evolution of Themes: How have the dominant themes evolved over time? For example, how did the initial focus on cryptography transition into the current interest in blockchain and federated learning?
5. Interdisciplinary Nature: The diverse range of influential works (from information theory to social science methodologies) suggests an interdisciplinary field. Consider exploring the connections between these different areas and how they contribute to the overall research domain.
By considering these points, you can create a richer and more critical interpretation of the RPYS results. Let me know if you’d like me to elaborate on any of these suggestions or analyze the data in a different way!
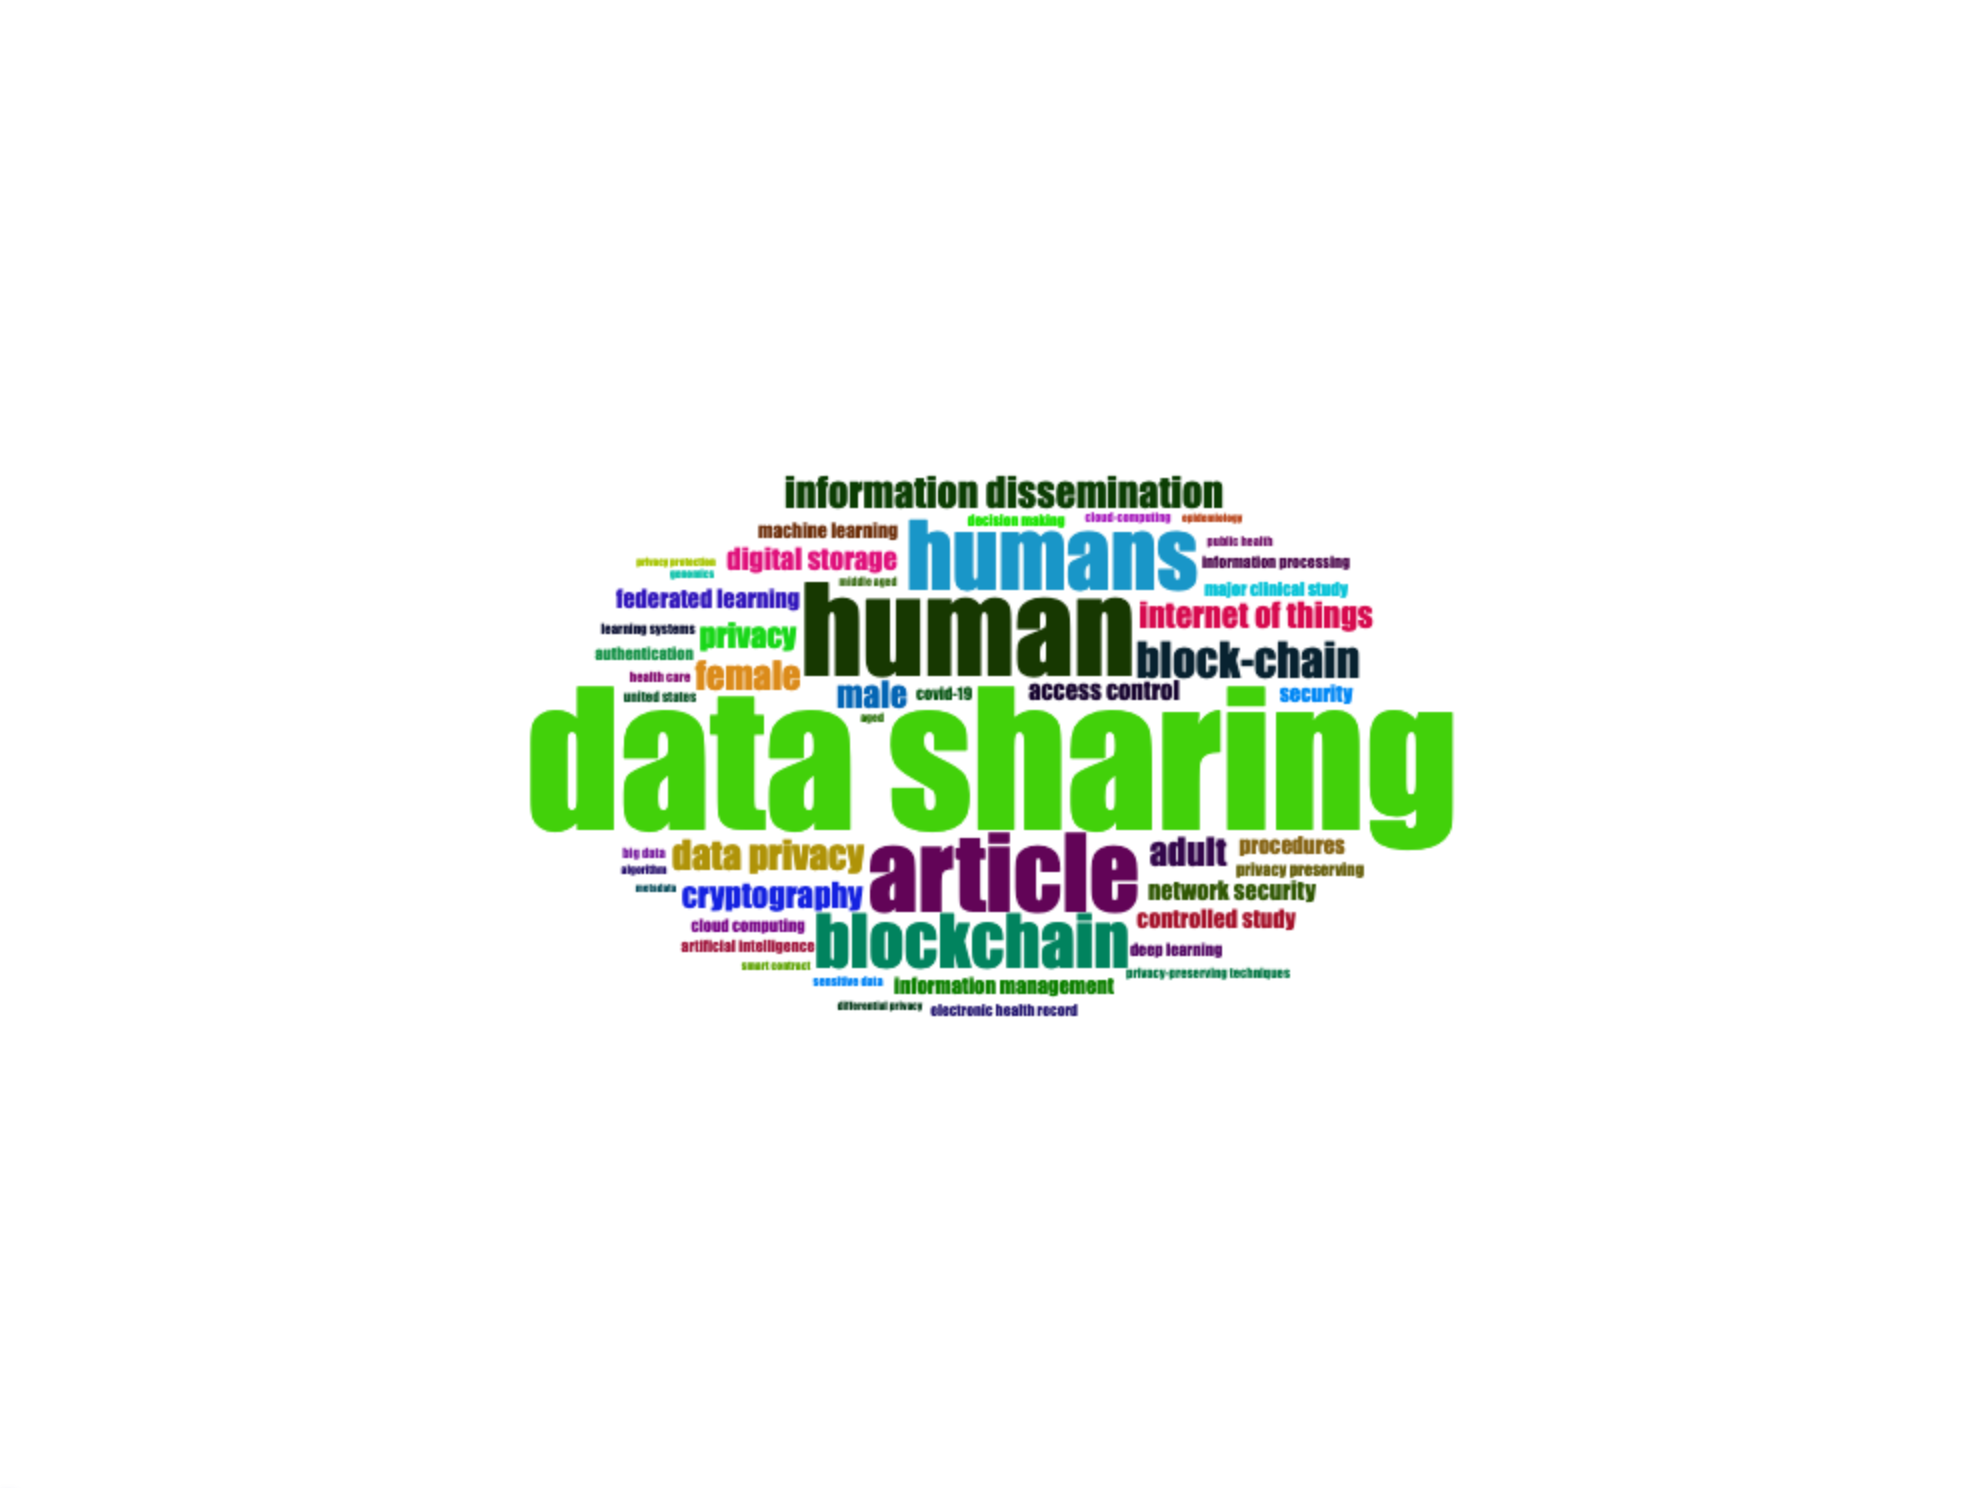
Most Frequent Words
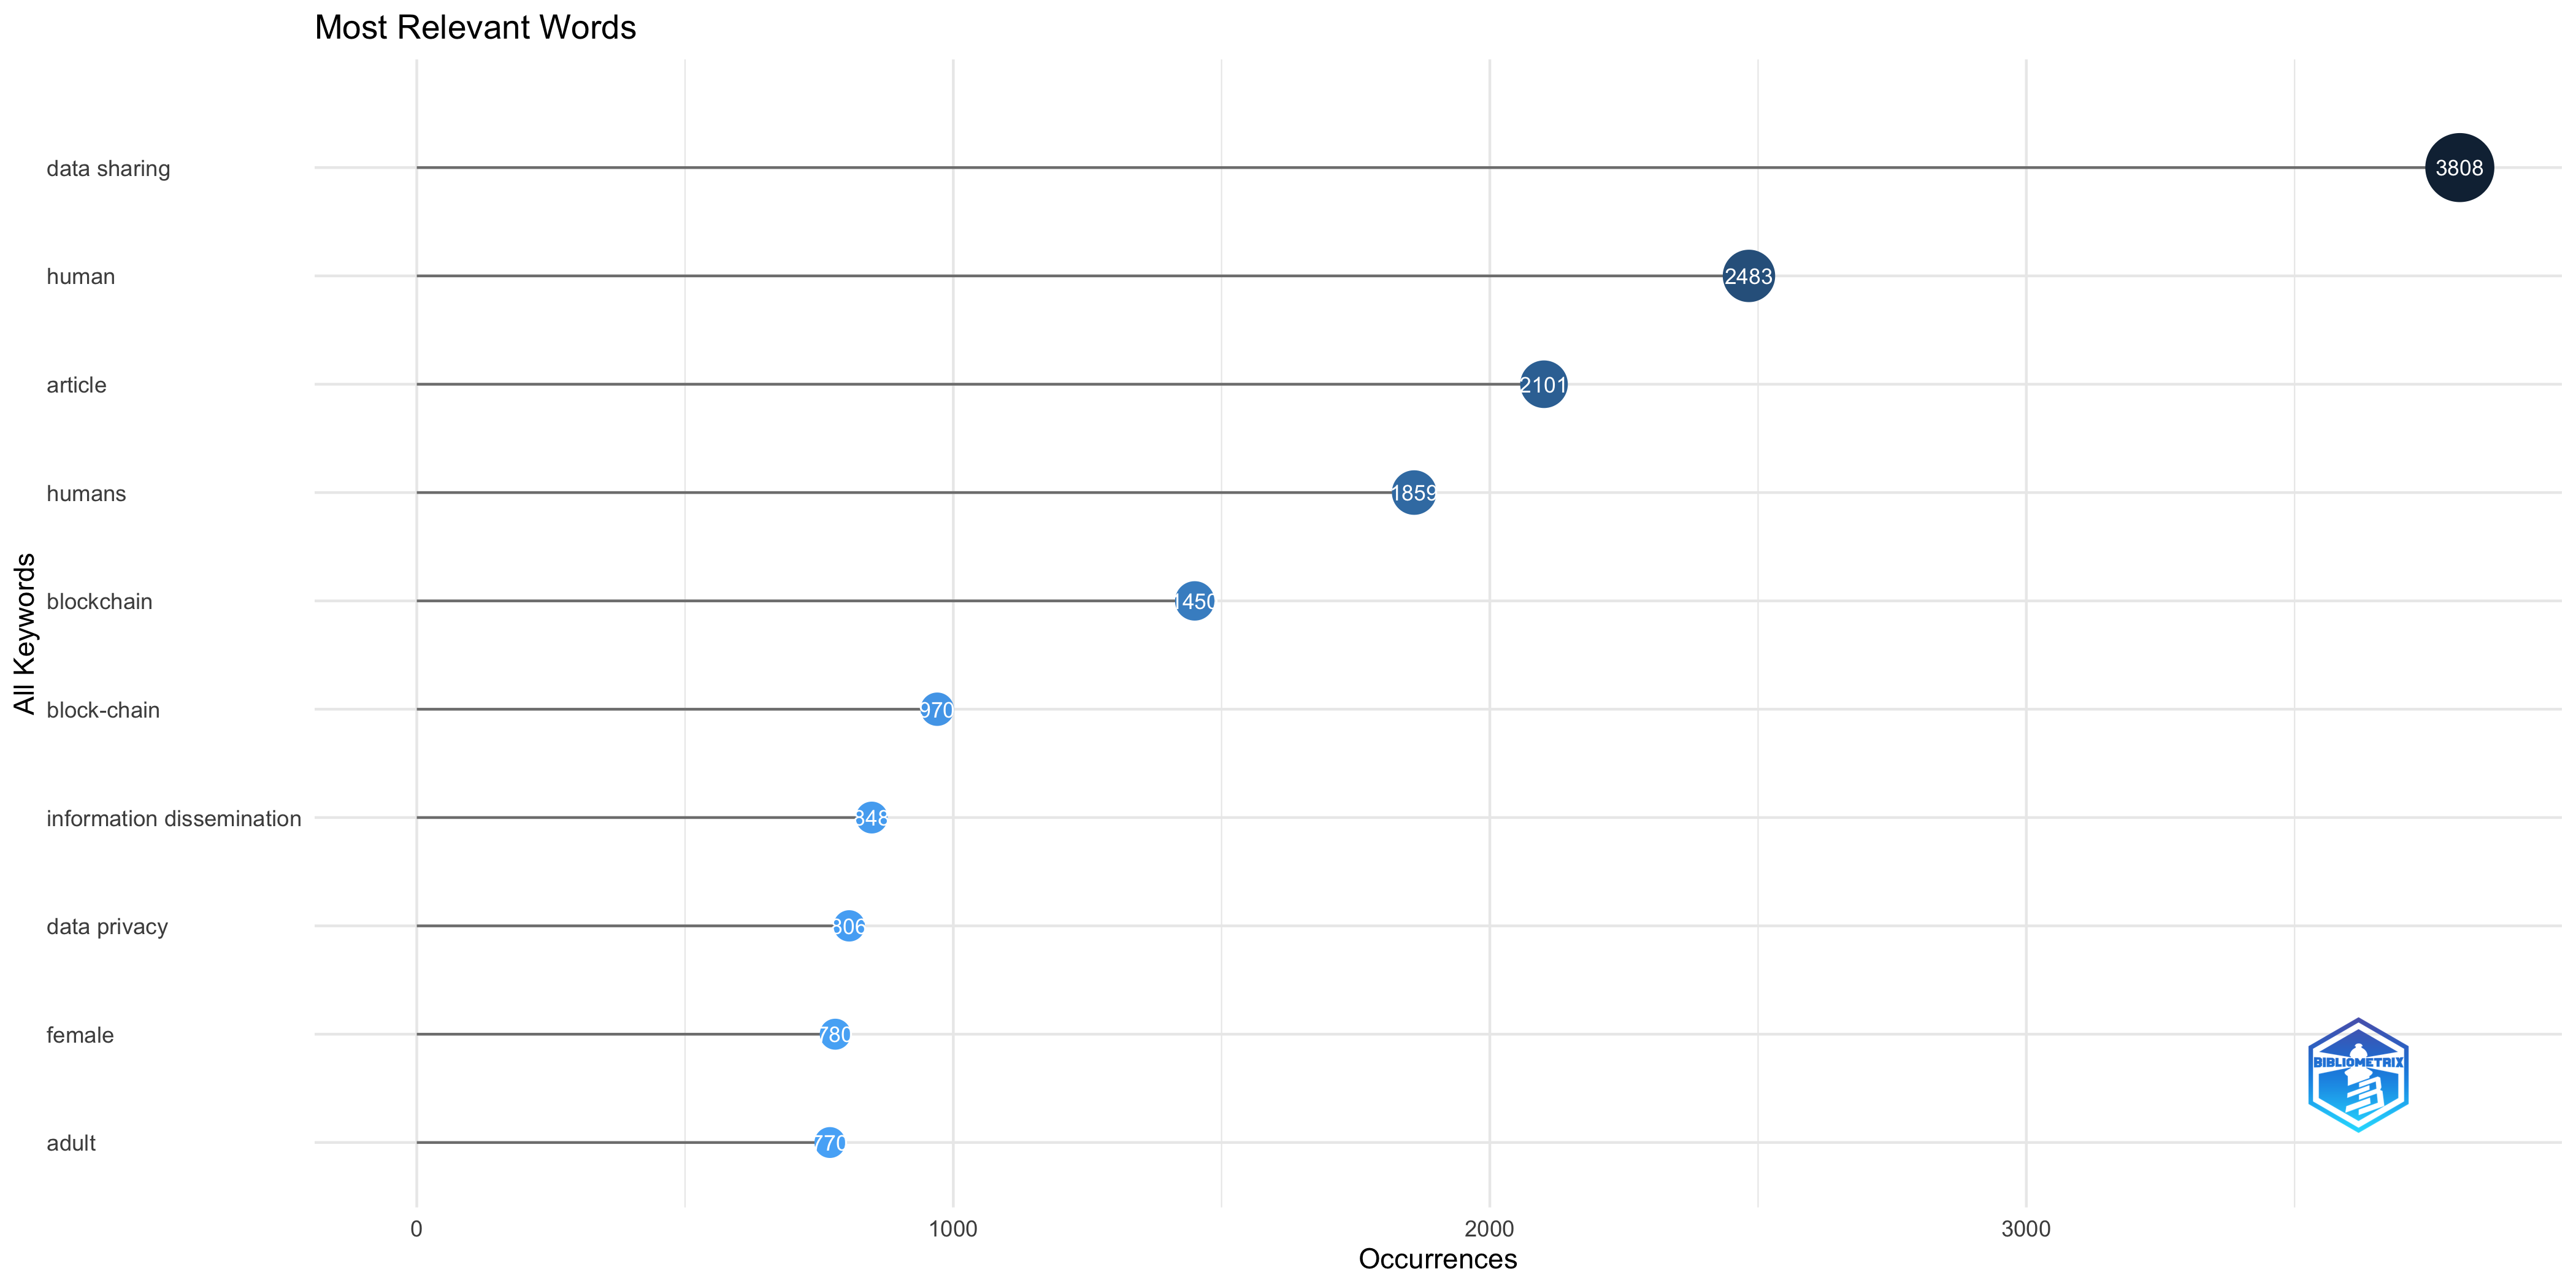
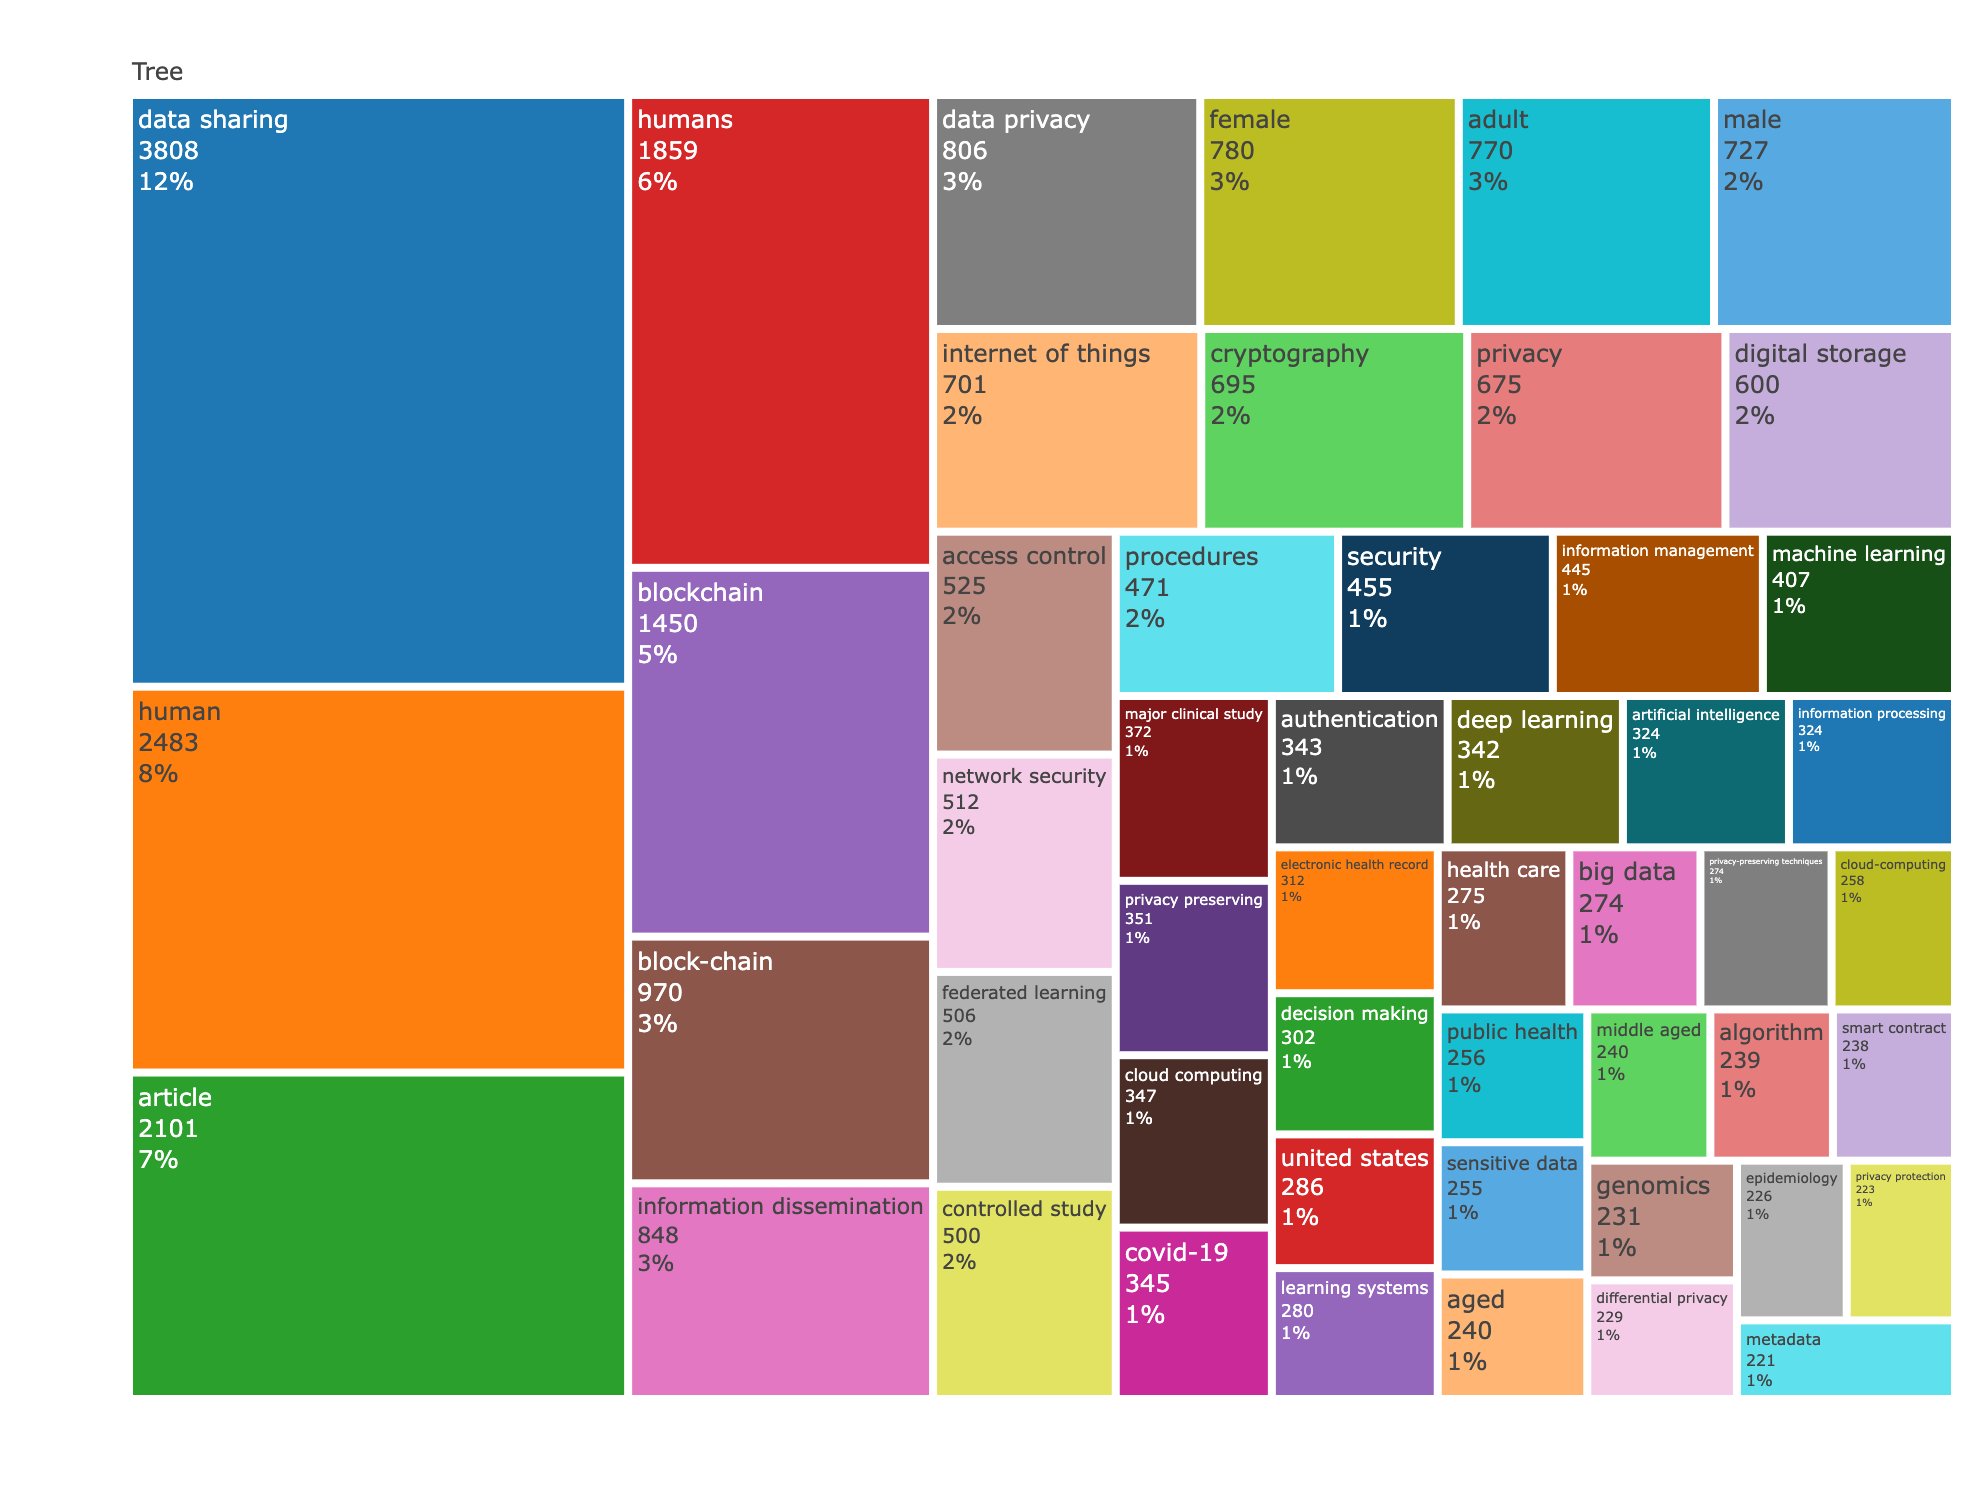
| data sharing | 3808 |
| human | 2483 |
| article | 2101 |
| humans | 1859 |
| blockchain | 1450 |
| block-chain | 970 |
| information dissemination | 848 |
| data privacy | 806 |
| female | 780 |
| adult | 770 |
| male | 727 |
| internet of things | 701 |
| cryptography | 695 |
| privacy | 675 |
| digital storage | 600 |
| access control | 525 |
| network security | 512 |
| federated learning | 506 |
| controlled study | 500 |
| procedures | 471 |
| security | 455 |
| information management | 445 |
| machine learning | 407 |
| major clinical study | 372 |
WordCloud
TreeMap
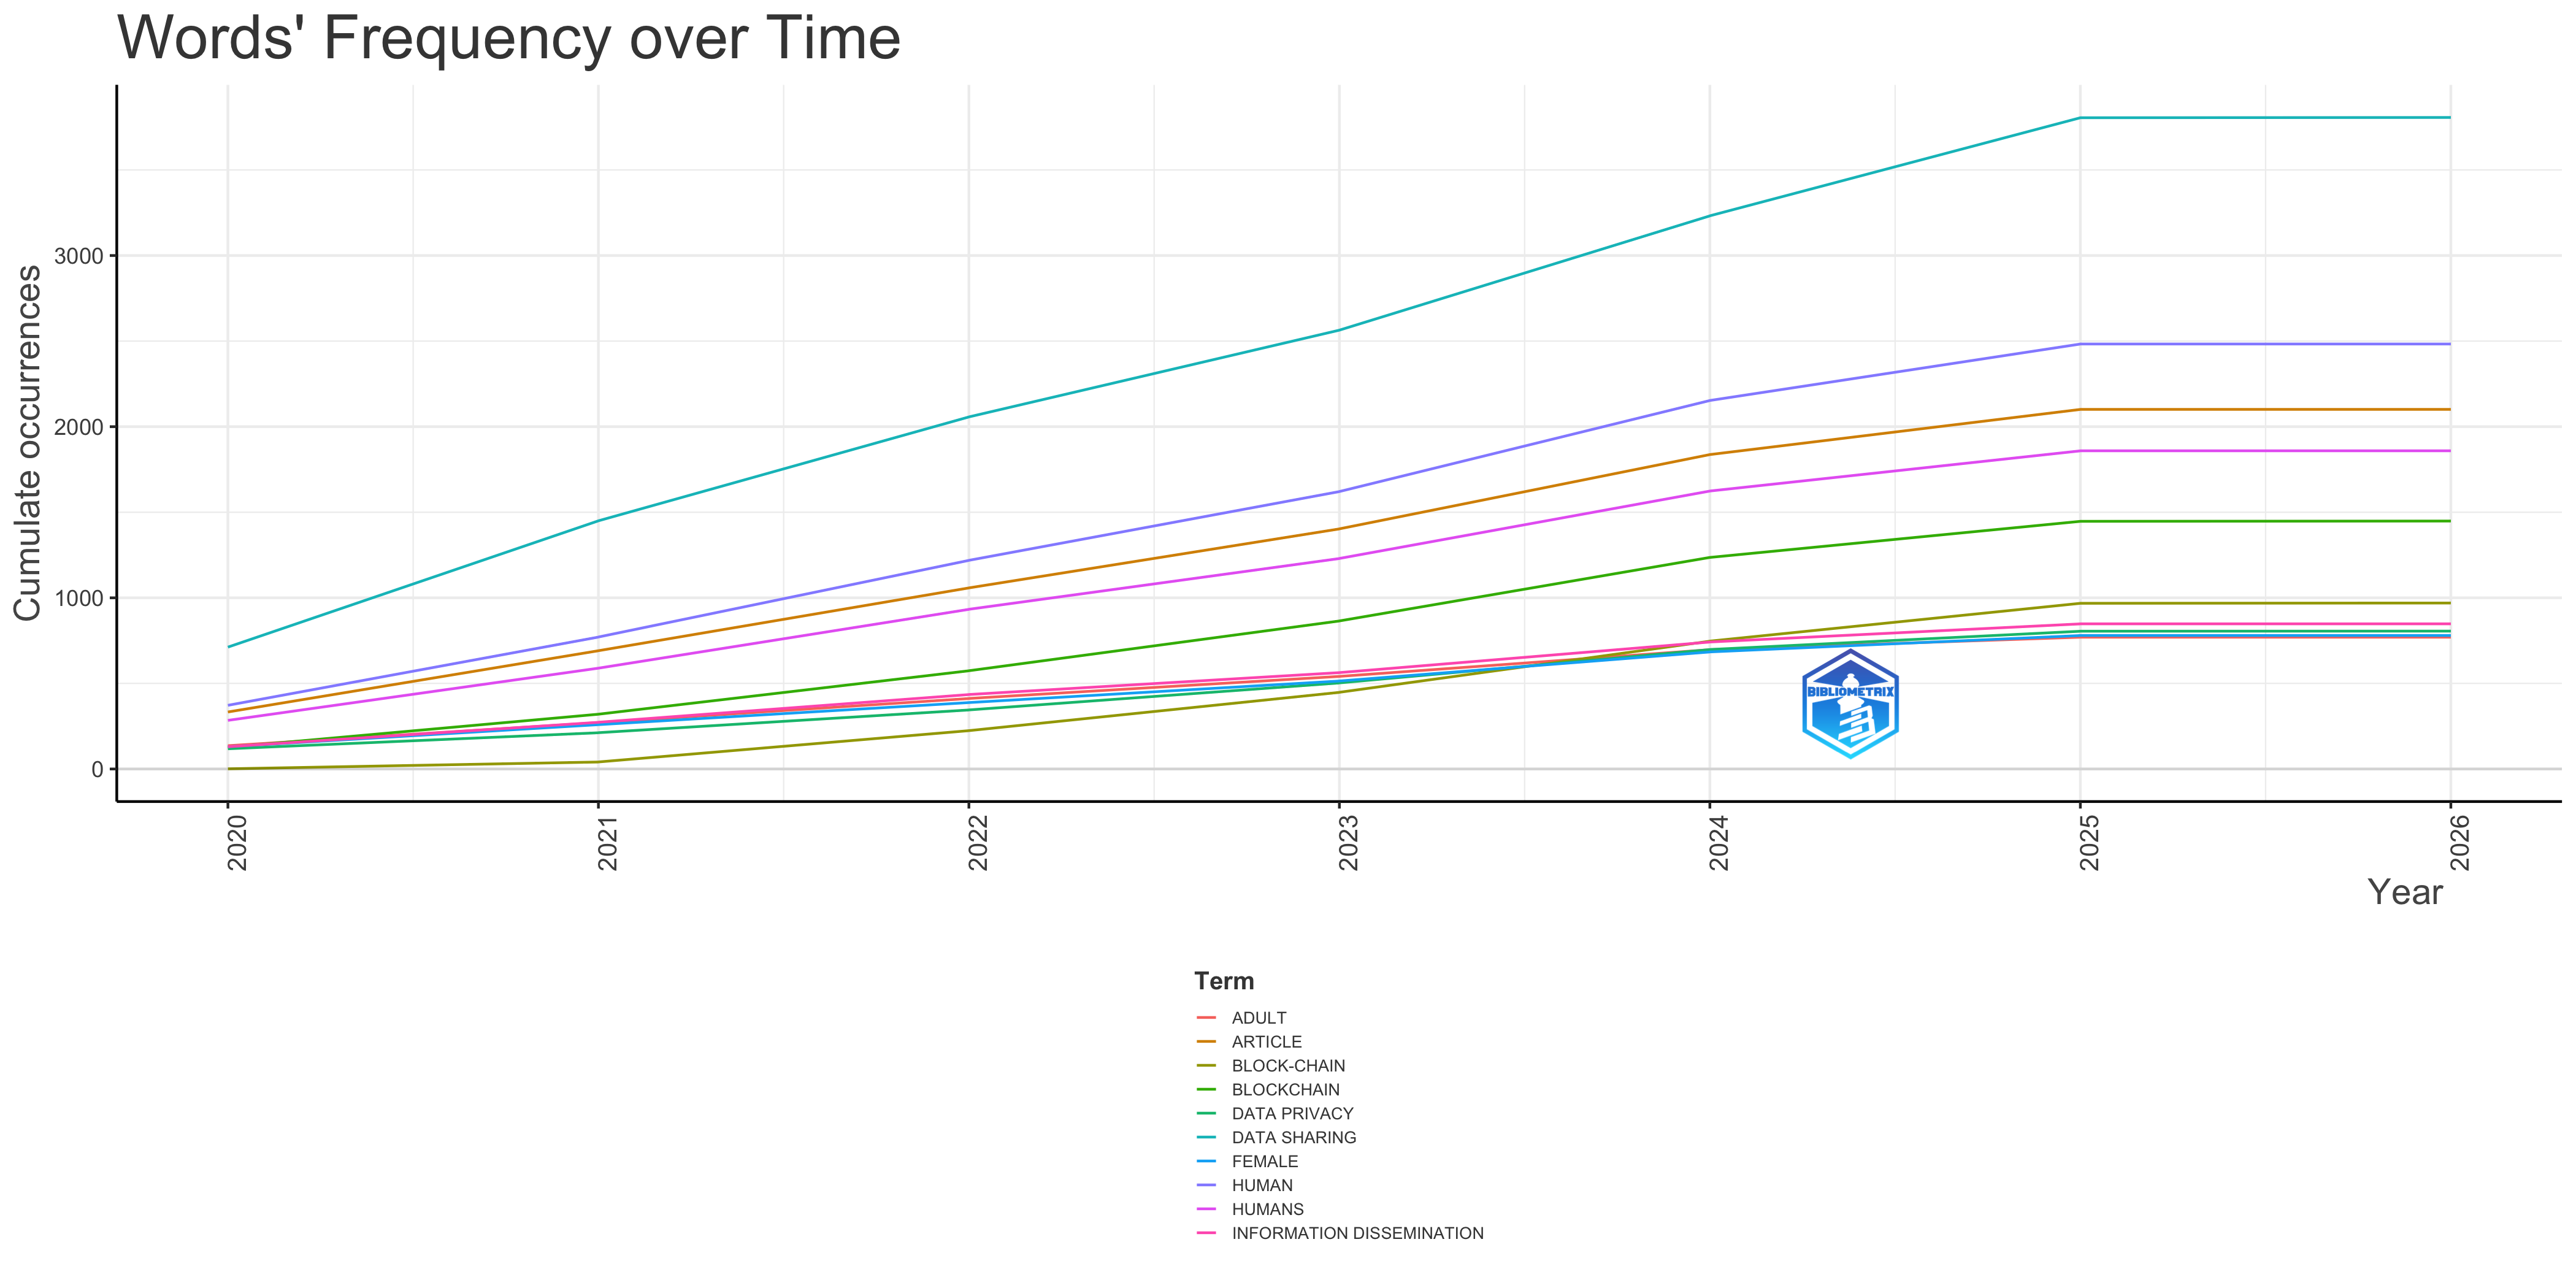
Words’ Frequency over Time
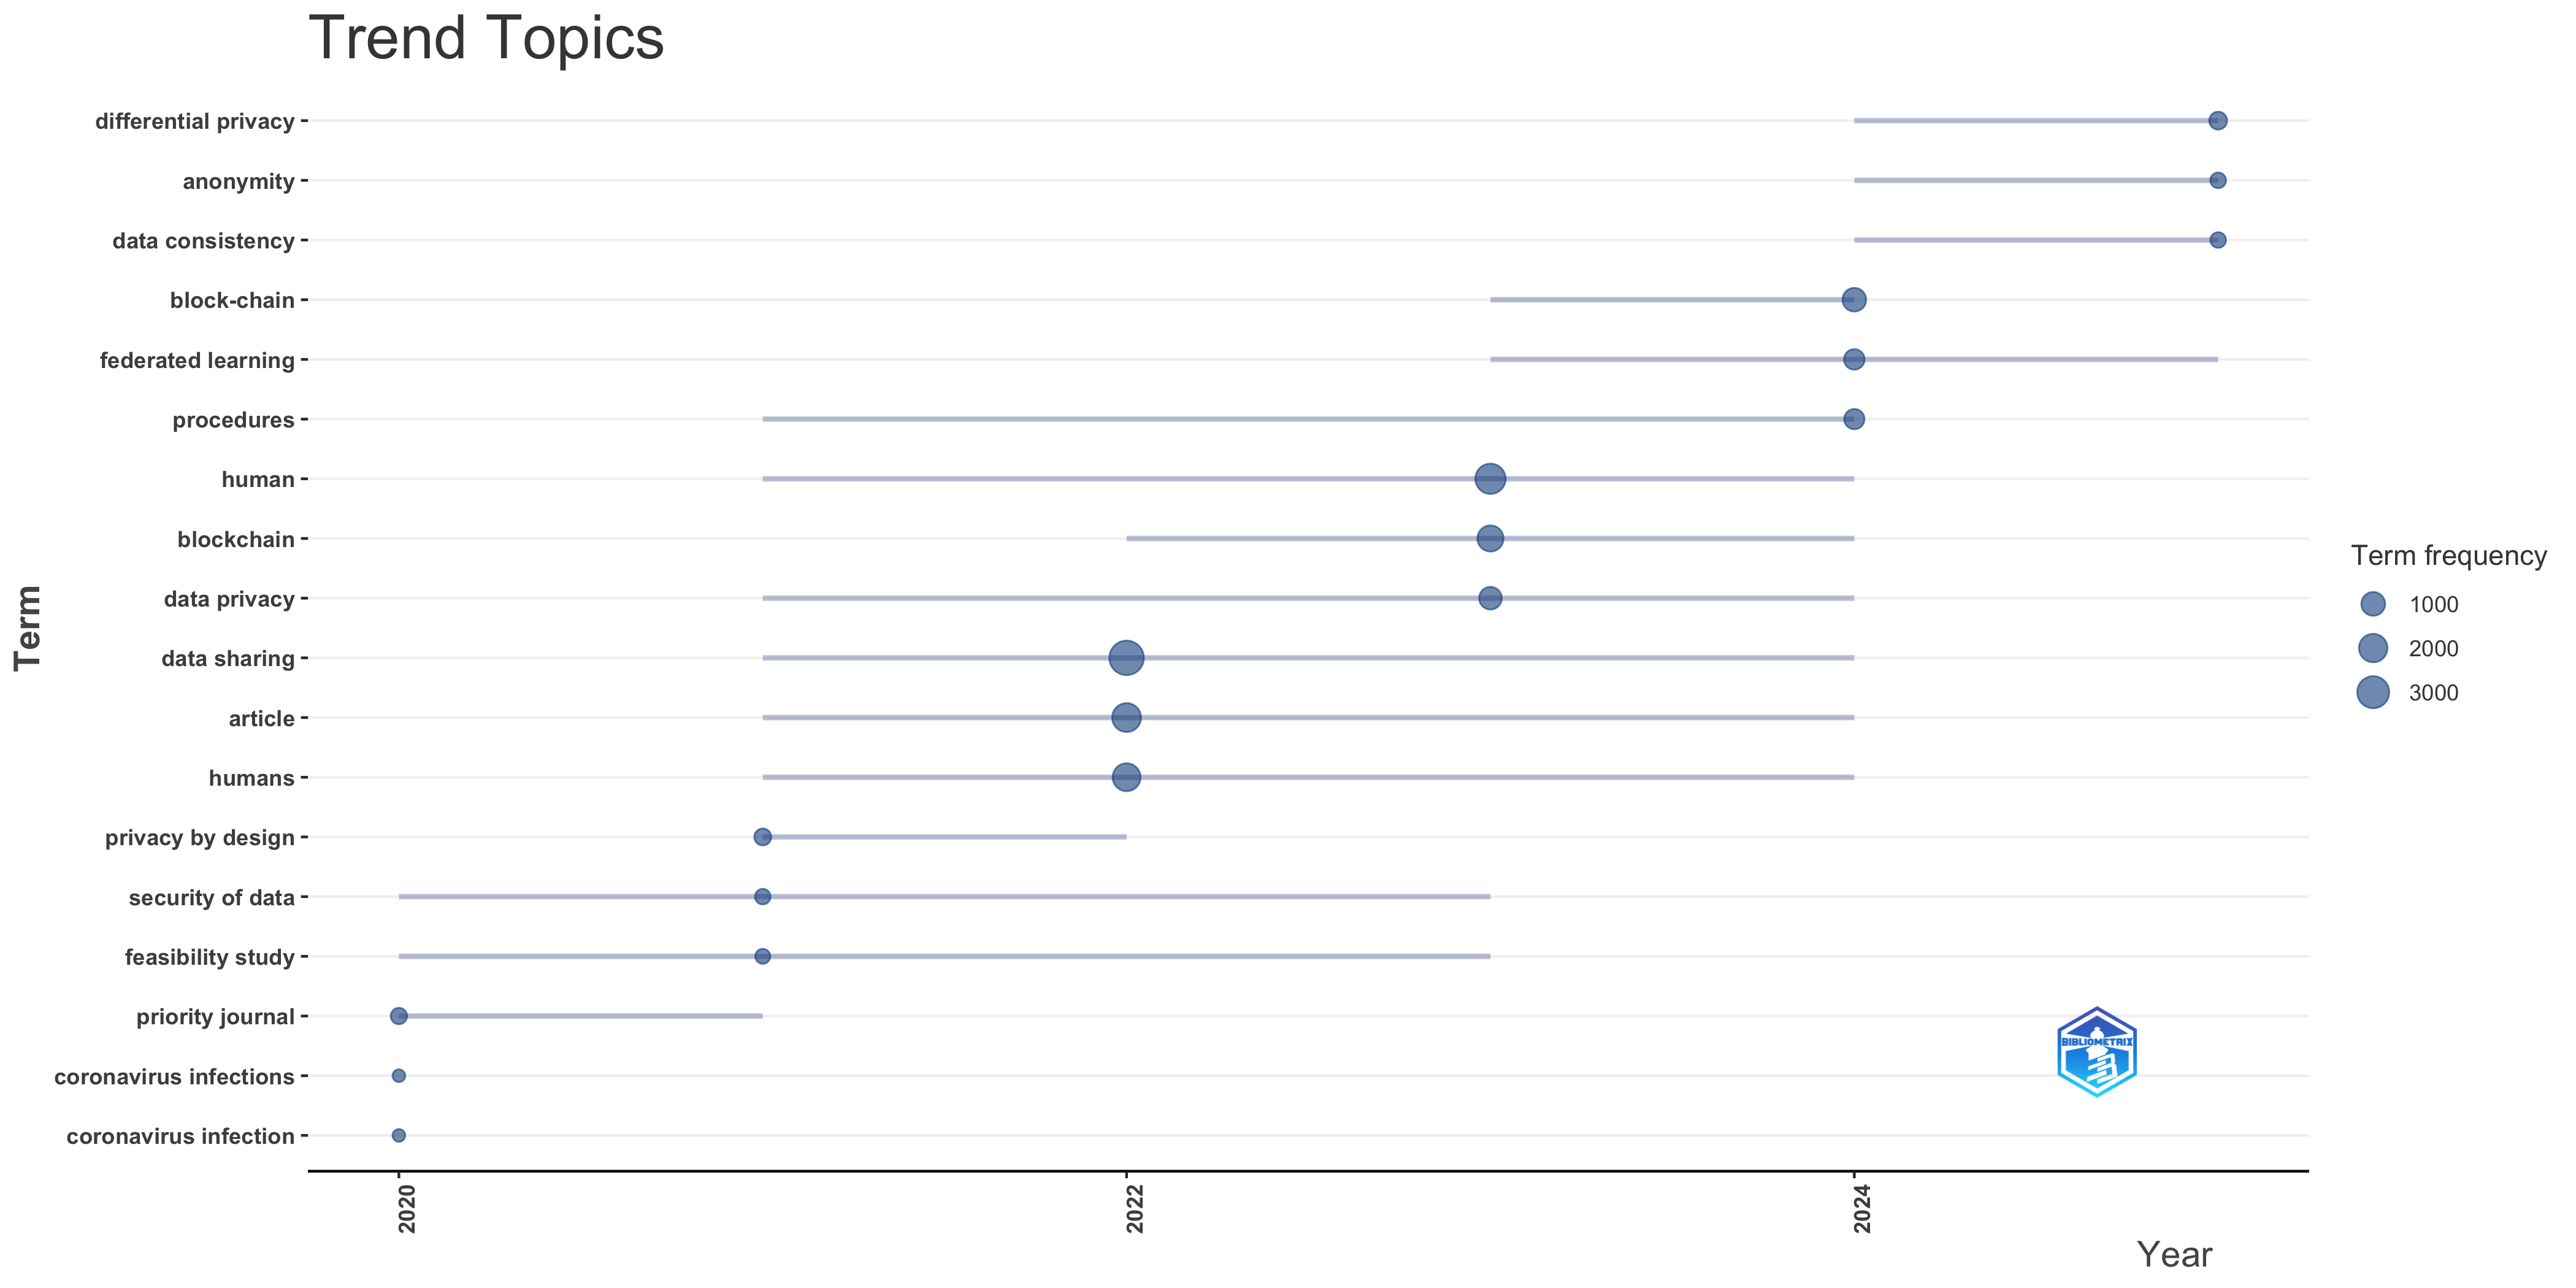
Trend Topics
Overall Trends and Observations
- Temporal Coverage: The analysis spans from approximately 2020 to 2024 (although most trends become clearly visible from 2022). This gives us a snapshot of emerging and evolving research themes over a relatively recent period.
- Keyword Selection: The use of “KW_Merged” as the textual field suggests that the keywords used for analysis are a combination of author-provided keywords and other metadata-derived terms. This can offer a more comprehensive representation of the research topics compared to solely relying on author-specified keywords.
- Bubble Size and Frequency: The size of the bubbles clearly indicates the prominence of certain terms. Larger bubbles represent higher frequency within the SCOPUS dataset for that specific year. The color intensity seems uniform and doesn’t convey additional information besides what the bubbles size is already providing.
- Interquartile Range (IQR): The light blue line shows the spread of the annual frequencies for each keyword, representing the IQR. A wider range means there’s more variability in how frequently the term appears in publications within that year.
Analysis by Keyword and Time Period
* Early Trends (2020-2022): The data from 2020 primarily highlights “Coronavirus infection” and “Coronavirus infections”, this shows the strong impact of the Covid-19 pandemic on research. The term “priority journal” is also highlighted. In 2022, keywords like “data sharing”, “data privacy”, “human”, “humans” and “article” have a stronger prominence.
* Emerging Trends (2024): From 2024 several new concepts related to data management and security become prominent: “differential privacy”, “anonymity”, “data consistency”, “block-chain”, and “federated learning”. This indicates that these concepts are emerging as significant research areas within the field covered by this SCOPUS dataset.
* Persistent Keywords:
* “procedures” shows to be an active keyword that maintains frequency over time, starting around 2022 and remaining significant in 2024.
* “Blockchain” shows to be gaining prominence between 2022 and 2024, being an active keyword.
Interpretation and Discussion Points
1. Impact of External Events: The prominence of “coronavirus infection/infections” in 2020 demonstrates how external events drive research agendas and publications. This highlights the responsiveness of the research community to immediate global challenges.
2. Evolving Focus on Data Privacy and Security: The emergence of “differential privacy,” “anonymity,” “data consistency,” “block-chain,” and “federated learning” in the last year of the data indicates a strong trend towards research in data privacy, security, and decentralized technologies. This is likely driven by increasing concerns about data breaches, privacy regulations (e.g., GDPR), and the growing importance of data-driven decision-making.
3. Data Sharing, Data Privacy, and Human-Centered Themes: The consistent presence of terms related to “data privacy,” “data sharing,” and “humans” suggests a persistent interest in the ethical and societal implications of data science and technology. This could reflect a growing awareness of the need for responsible data handling and a focus on human-centered design.
4. Methodological Focus (“article”): The term “article” as a key term could imply that a certain type of article is a major contribution to the field.
5. Broader Context is Crucial: To fully interpret these trends, you need to consider the specific scope of the SCOPUS collection you analyzed. Knowing the subject areas covered by the collection is essential to provide a more targeted and insightful interpretation. For example, if the collection focuses on computer science, the prominence of blockchain and data privacy terms would be expected.
Critical Considerations and Further Exploration
- Database Bias: Remember that SCOPUS has its own biases in terms of journal coverage and subject representation. The observed trends may not be fully representative of the entire research landscape.
- Keyword Definition: “KW_Merged” provides comprehensive insight from the article, but keep in mind that this merging process might also introduce noise or ambiguity.
- Granularity of Analysis: Using only the top 3 words per year may oversimplify the trends. Consider experimenting with a larger number of keywords to capture a more nuanced picture.
- Qualitative Analysis: Complement this quantitative analysis with a qualitative review of some of the key papers associated with these trending topics. This can provide deeper insights into the specific research questions, methodologies, and findings within each area.
- Statistical Significance: Consider assessing the statistical significance of the changes in keyword frequency over time to determine whether the observed trends are truly meaningful.
By considering these points, you can develop a robust and well-supported interpretation of your trend topics plot. Remember to tailor your discussion to the specific research question and audience of your bibliometric analysis.
Clustering by Coupling
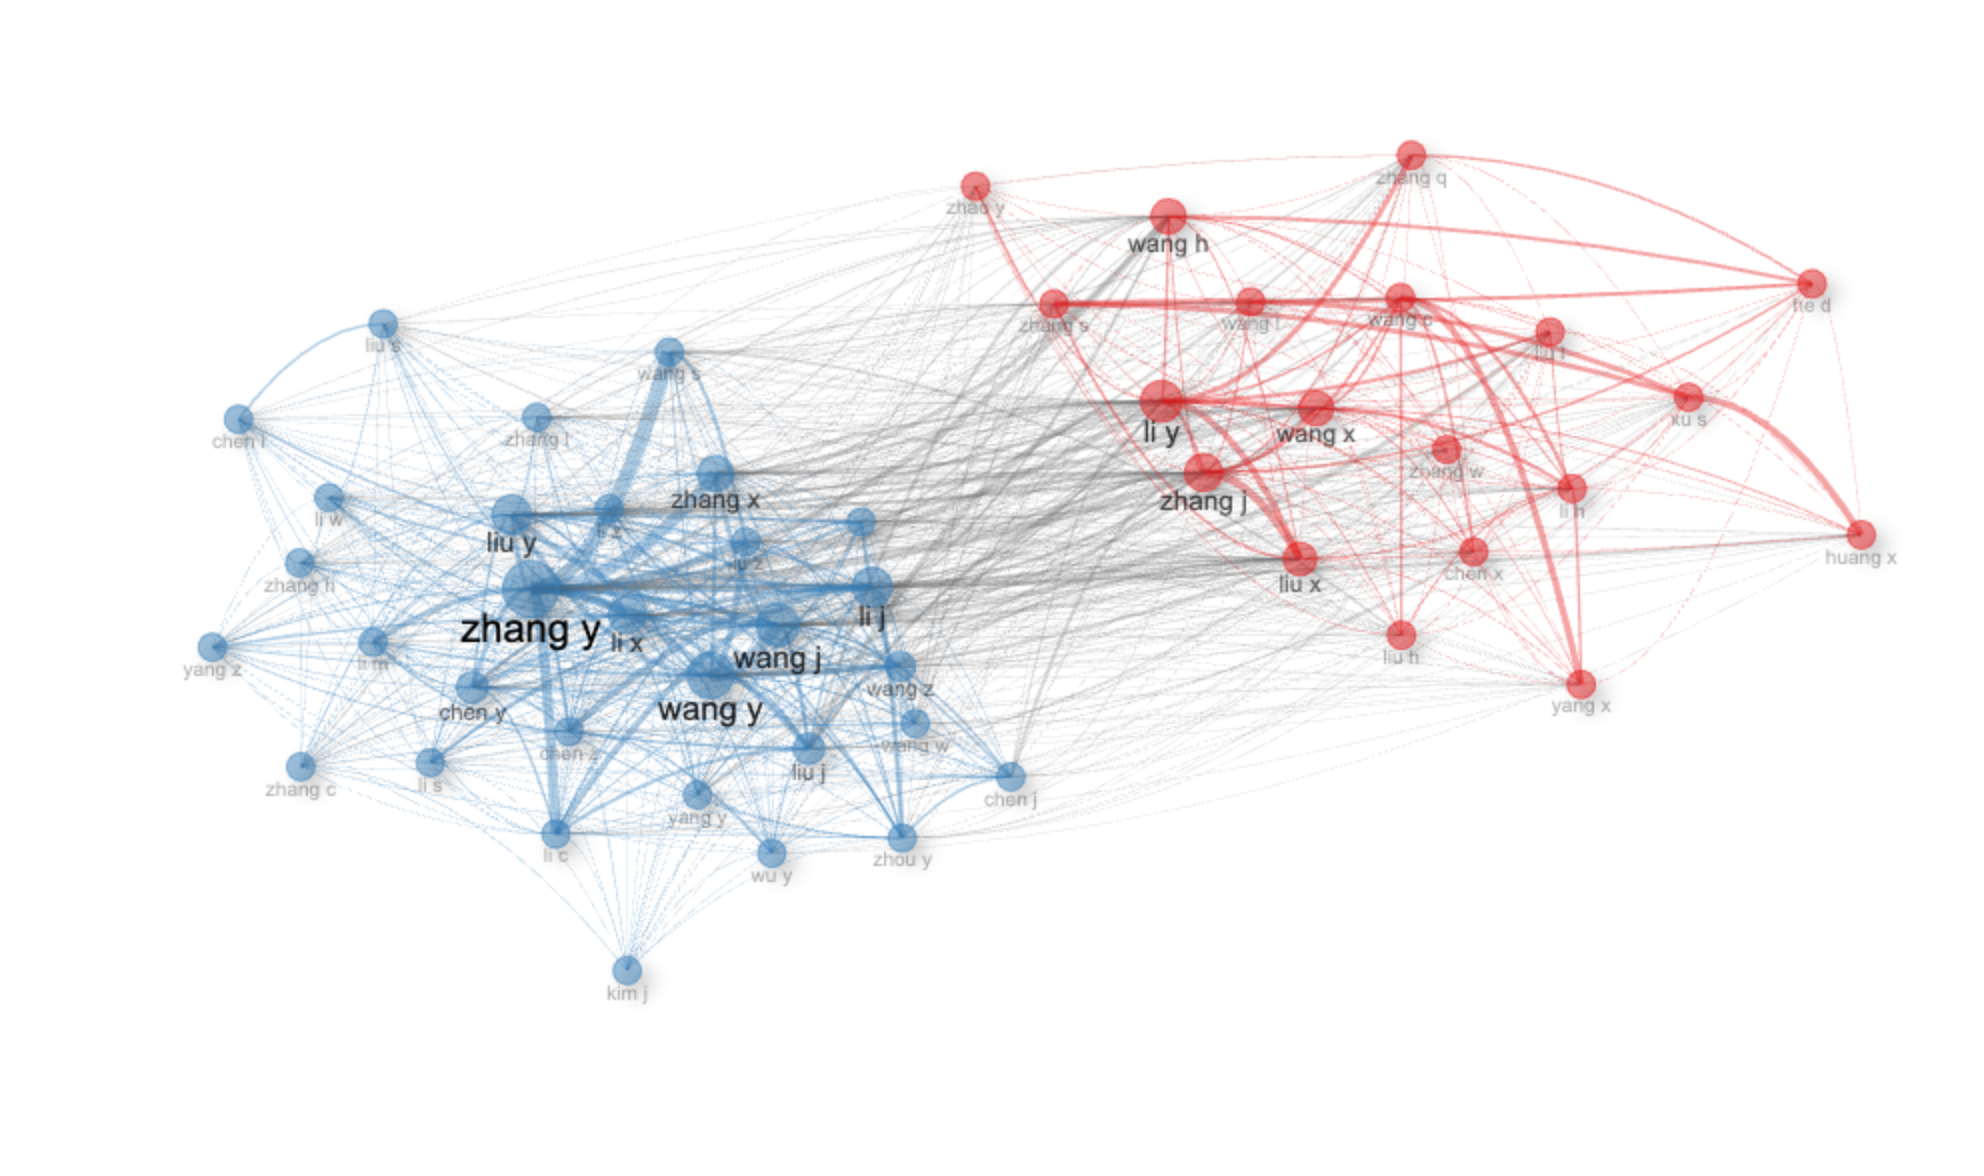
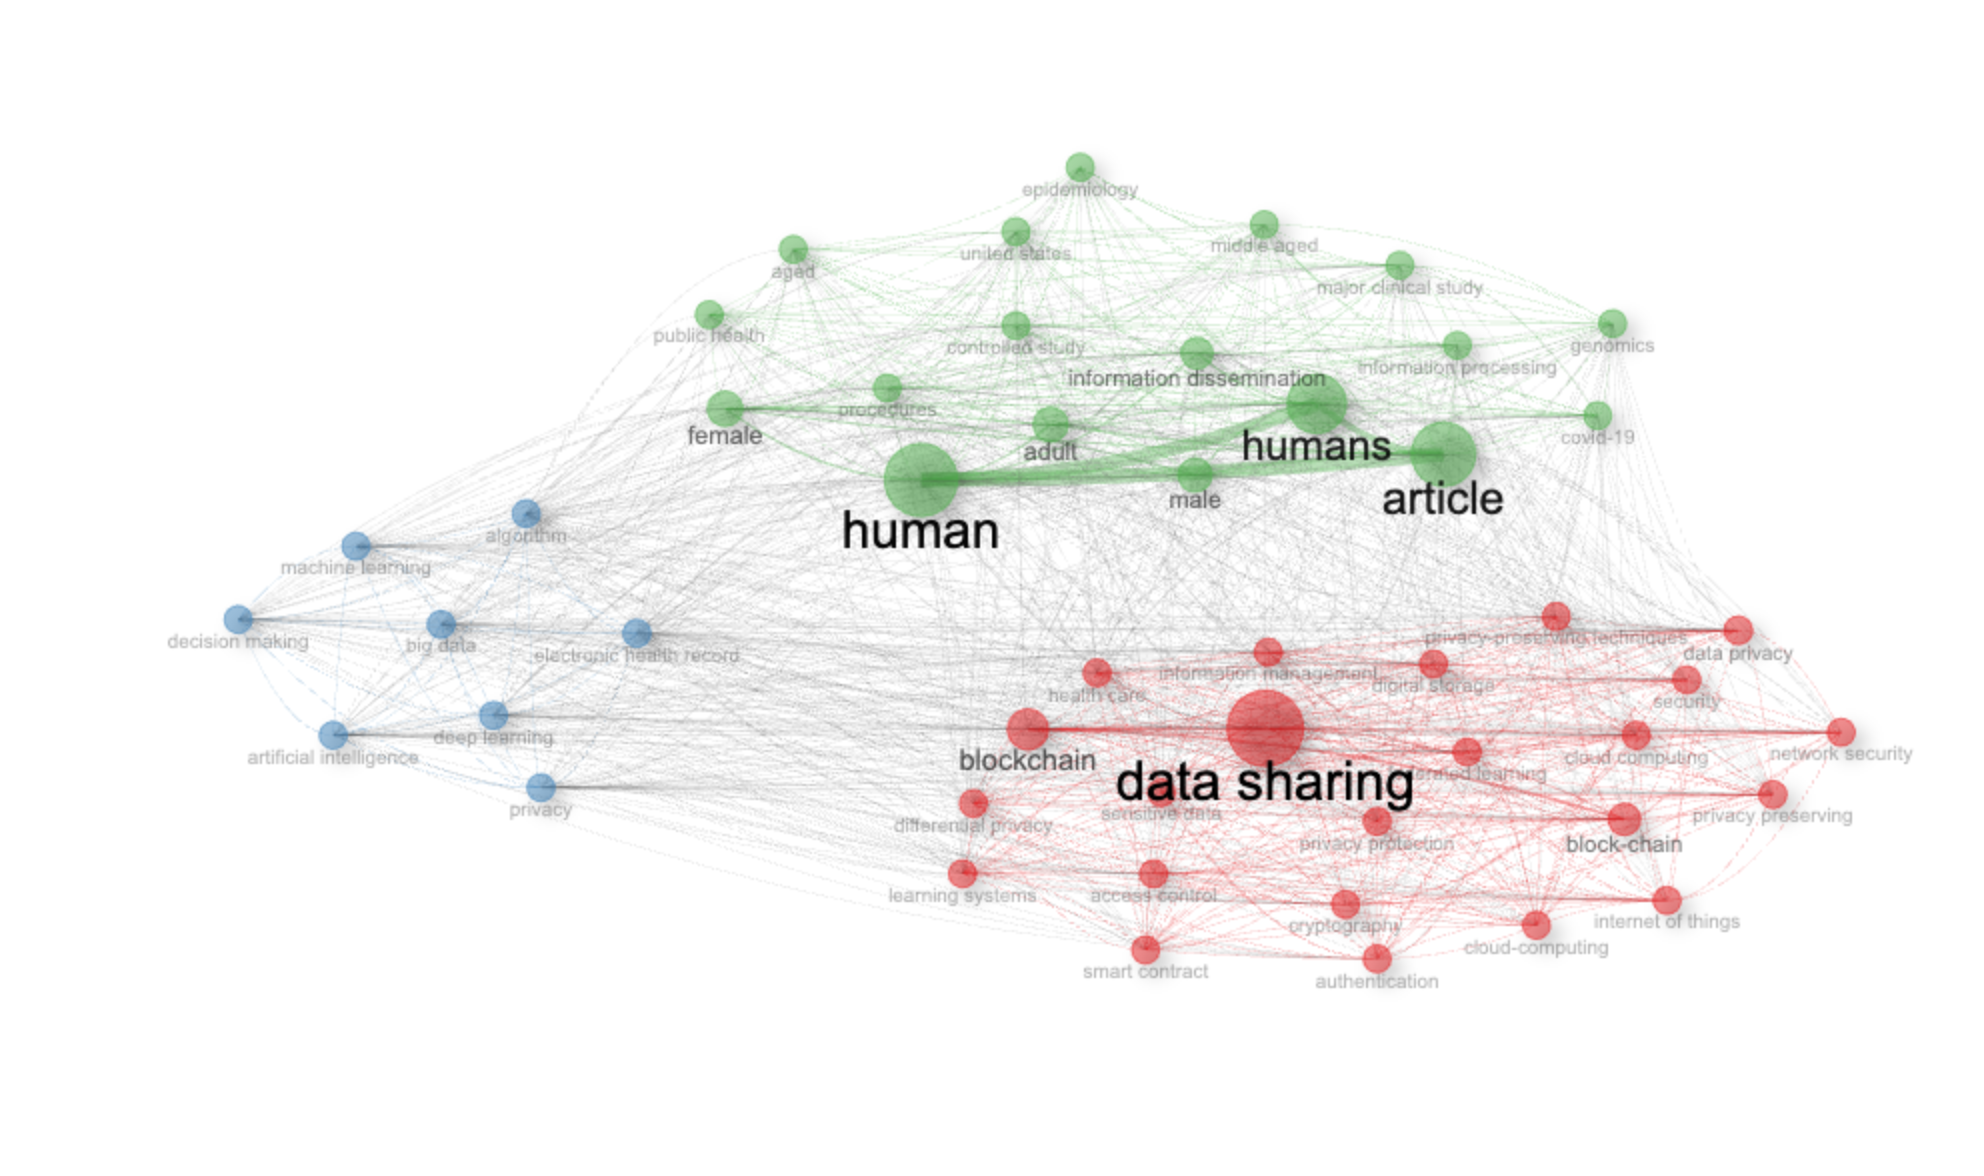
Co-occurrence Network
Overall Structure and General Observations:
- Network Type: The network represents the co-occurrence of keywords in your SCOPUS dataset. The ‘normalize: association’ parameter means the strength of the connections (edge weights) is based on the association strength, a measure that considers the probability of two keywords appearing together relative to their individual frequencies.
- Node Size: The size of each node is proportional to the frequency of the keyword in the dataset. Larger nodes represent more frequently used keywords.
- Edge Thickness: The thickness of the edges represents the strength of the co-occurrence between the connected keywords. Thicker edges indicate a stronger association.
- Clustering: The network uses the Walktrap algorithm for community detection, which aims to identify clusters of nodes that are densely connected within themselves and sparsely connected to other clusters. The `community.repulsion` parameter aims to spread out the clusters visually, but in this case, there is significant overlap.
- Communities/Clusters: The network appears to have three distinct communities, visually represented by different colors (green, red, and blue). These likely represent different thematic areas within your dataset.
Interpretation of Specific Elements:
1. Most Connected Terms (Central Nodes):
* “Data Sharing”: The largest node, “Data sharing,” suggests it’s a highly prevalent theme in your dataset. The red color indicates that it belongs to a specific community or topic.
* “Human” and “Humans”: The second most largest nodes, “human” and “humans”, indicate a prevalent focus on this entity.
* “Article”: The third most largest node is the term “article”, likely indicating an abundance of traditional published studies.
2. Community Analysis:
* Red Cluster (Data Sharing & Technology): This cluster, centered around “Data Sharing,” appears to focus on technological aspects. Keywords like “Blockchain,” “Cloud Computing,” “Network Security,” “Internet of Things,” “Privacy,” “Cryptography,” “Smart Contract,” and “Authentication” are strongly associated. This cluster suggests research related to secure and privacy-preserving data sharing technologies, especially in areas like cloud environments and IoT.
* Green Cluster (Epidemiology & Human Studies): This cluster, located at the top of the network, seems centered on human studies and clinical research. Keywords such as “Human”, “Humans”, “Adult,” “Male,” “Female,” “Aged,” “Middle Aged,” “United States,” “Epidemiology,” “Controlled Study,” “Information Dissemination,” and “Genomics” suggest a strong emphasis on demographic studies, epidemiological research, and potentially clinical trials. The presence of “Covid-19” also points towards studies related to the pandemic.
* Blue Cluster (AI & Machine Learning): This cluster, located at the bottom left of the network, is focused on AI and machine learning methods. It includes terms such as “Artificial Intelligence,” “Machine Learning,” “Deep Learning,” “Algorithms,” “Big Data,” and “Decision Making,”. This suggests research around using AI techniques for different purposes.
3. Relationships Between Clusters:
* The connections between the clusters indicate interdisciplinary work. For example, the connections between the AI/ML cluster (blue) and the Data Sharing cluster (red) suggest research on using AI for data sharing, privacy, or security applications. The connections between the epidemiology cluster (green) and other clusters could denote applications of AI or data sharing in a health-related context.
Critical Discussion Points & Questions to Explore Further:
- Context of “Data Sharing”: What specific types of data are being shared in the research represented by this network? Is it medical data, financial data, or something else? The surrounding keywords suggest a focus on sensitive data.
- Dominance of “Data Sharing”: Why is “Data Sharing” such a prominent term? Is this a relatively new and rapidly growing area of research? What factors have contributed to its importance?
- Specificity of AI Applications: In the AI/ML cluster, what specific problems are these methods being applied to? The connection to electronic health records offers one hint.
- Ethical Implications: Given the presence of “Privacy,” “Data Privacy,” and “Differential Privacy,” what are the ethical considerations being addressed in these studies related to data sharing and AI?
- Missing Themes: Are there any significant themes or keywords that are absent from this network? This could indicate gaps in the research landscape. Consider the search strategy used to retrieve the SCOPUS data – was it broad enough to capture all relevant areas?
Recommendations for Further Analysis:
- Temporal Analysis: Analyze the network over time to see how these themes have evolved. Are the connections between clusters strengthening or weakening?
- Author Analysis: Identify key authors working at the intersection of these clusters.
- Journal Analysis: Determine which journals are publishing research that spans multiple clusters.
- Keyword Plus Analysis: Consider using keyword plus terms, which often identify more specific topics than author keywords.
By exploring these questions and conducting further analyses, you can gain a deeper understanding of the research landscape represented by your SCOPUS dataset and identify potential areas for future research. Remember that this is just a starting point, and the most valuable insights will come from your own expertise and critical evaluation of the data.
| data sharing | 1 | 55.402 | 0.021 | 0.070 |
| blockchain | 1 | 3.668 | 0.020 | 0.040 |
| block-chain | 1 | 0.817 | 0.018 | 0.031 |
| data privacy | 1 | 4.936 | 0.021 | 0.025 |
| internet of things | 1 | 0.240 | 0.018 | 0.021 |
| cryptography | 1 | 0.201 | 0.018 | 0.022 |
| digital storage | 1 | 0.415 | 0.019 | 0.019 |
| access control | 1 | 0.151 | 0.017 | 0.018 |
| network security | 1 | 0.208 | 0.018 | 0.017 |
| federated learning | 1 | 0.433 | 0.020 | 0.015 |
| security | 1 | 0.772 | 0.020 | 0.016 |
| information management | 1 | 0.518 | 0.020 | 0.013 |
| privacy preserving | 1 | 0.303 | 0.019 | 0.014 |
| cloud computing | 1 | 0.681 | 0.020 | 0.012 |
| authentication | 1 | 0.047 | 0.017 | 0.013 |
| learning systems | 1 | 0.116 | 0.019 | 0.011 |
| health care | 1 | 0.953 | 0.020 | 0.012 |
| privacy-preserving techniques | 1 | 0.181 | 0.019 | 0.012 |
| cloud-computing | 1 | 0.044 | 0.017 | 0.011 |
| sensitive data | 1 | 0.208 | 0.019 | 0.011 |
| smart contract | 1 | 0.011 | 0.016 | 0.010 |
| differential privacy | 1 | 0.051 | 0.018 | 0.008 |
| privacy protection | 1 | 0.100 | 0.019 | 0.009 |
| privacy | 2 | 4.356 | 0.021 | 0.024 |
| machine learning | 2 | 0.586 | 0.021 | 0.013 |
Thematic Map
Understanding the Strategic Map
The strategic diagram you’ve generated is a powerful tool for visualizing the intellectual structure of the research field you’re investigating. It’s based on the centrality and density of keyword clusters.
- Centrality (Relevance Degree – X-axis): Indicates the importance of a theme to other themes within the network. High centrality means a theme is strongly connected to other key research areas and thus plays a central, organizing role. Themes on the right side of the map are more central.
- Density (Development Degree – Y-axis): Represents the internal strength of the theme, reflecting how developed and cohesive the research within that area is. High density means a theme is well-developed with strong internal links. Themes on the upper part of the map are more developed.
The four quadrants of the map have specific meanings:
- Motor Themes (Upper Right): High centrality and high density. These are the dominant, well-developed themes driving the field.
- Basic Themes (Lower Right): High centrality but low density. These are fundamental, but perhaps less developed, themes that are important to the field’s overall structure. They may be emerging areas with potential for growth.
- Niche Themes (Upper Left): High density but low centrality. These are specialized areas that are well-developed internally but have weaker links to the broader field.
- Emerging or Declining Themes (Lower Left): Low centrality and low density. These themes are either newly emerging or fading in importance.
Analysis of the Clusters
Based on the image and data you provided, here’s an interpretation of each cluster:
1. “Human” Cluster:
* Position: Appears in the Motor Themes quadrant (high centrality, high density).
* Interpretation: This indicates that research focused on “human” aspects is a dominant and well-developed theme in your dataset. It’s central to the field and has a strong, cohesive body of literature. This suggests a significant focus on how research impacts or involves humans.
* Key Articles:
* LI J, 2020, ARTIF INTELL MED (pagerank 0.351) – Likely focuses on the application of artificial intelligence in medicine with a strong human-centered aspect.
* CHOW E, 2024, J MED INTERNET RES (pagerank 0.323) – Probably explores human interaction or impact in the context of medical internet research.
* HAMILTON DG, 2024, ASIA-PAC J CLIN ONCOL (pagerank 0.322) – Likely examines human-related issues within clinical oncology in the Asia-Pacific region.
* Further Investigation: Explore *how* the “human” element is being studied (e.g., human-computer interaction, patient outcomes, ethical considerations). What specific aspects of the human experience are most prominent in these articles?
2. “Data Sharing” Cluster:
* Position: Appears in the Emerging or Declining Themes/Niche Themes quadrant (low centrality, high density). From the image, it is on the left, which means low centrality, and above the dashed line, which means high density.
* Interpretation: This theme has a high degree of internal development (“blockchain,” “block-chain”), suggesting a well-defined and actively researched area. However, its lower centrality indicates that it is less connected to the other main themes in your network. This might represent a specialized field with strong internal development but potentially limited influence on the broader research landscape represented by your data. It could also represent an emerging theme if it is on the lower side.
* Key Articles:
* BAO Y, 2022, IEEE J BIOMEDICAL HEALTH INFORMAT (pagerank 0.286)
* QU Z, 2024, IEEE J BIOMEDICAL HEALTH INFORMAT (pagerank 0.226)
* LIU H, 2024, IEEE J BIOMEDICAL HEALTH INFORMAT (pagerank 0.22)
* Further Investigation: Is “data sharing” related to a specific application area (e.g., genomics, imaging)? Is the blockchain application specific or broadly applicable? Explore potential reasons for its lower centrality. Are there barriers preventing this theme from connecting more strongly to other areas? Is it a genuinely novel approach that needs more time to integrate?
3. “Privacy” Cluster:
* Position: Appears in the Basic Themes quadrant (high centrality, low density).
* Interpretation: “Privacy,” along with “machine learning” and “deep learning” is a fundamental theme (high centrality) but less developed in this specific dataset (low density). This suggests that while privacy concerns are recognized as important to the overall research area, it is not as extensively studied within the specific context defined by your keyword search and inclusion criteria.
* Key Articles:
* LIU J, 2023, IEEE J BIOMEDICAL HEALTH INFORMAT (pagerank 0.339)
* YOON J, 2020, IEEE J BIOMEDICAL HEALTH INFORMAT (pagerank 0.267)
* WU C, 2024, INT J MED INFORMATICS (pagerank 0.257)
* Further Investigation: Examine why “privacy” has lower density. Is it because it’s primarily addressed through theoretical frameworks or legal/ethical discussions rather than empirical studies? Is it implicitly addressed within the “human” theme? Consider whether the search terms adequately capture the nuances of privacy research in the field.
Overall Interpretation and Considerations
- The “Human” theme’s dominance is a key finding. This suggests that ethical considerations, human-centered design, or patient-related outcomes are central concerns in this research area.
- The strategic map highlights a potential disconnect between the well-developed “Data Sharing” (potentially blockchain-related) and the core themes of “Human” and “Privacy.” Further research could explore how to better integrate data sharing technologies with human needs and privacy safeguards.
- The “Privacy” cluster’s position suggests that while recognized as important, it may not be as actively researched or developed within the specific scope of your dataset. This could point to a gap in the research landscape.
Critical Discussion Points
- Keyword Selection: The choice of “KW\_Merged” as the field for analysis is important. Consider if this is the most appropriate field or whether other keyword fields might reveal different relationships.
- Parameter Settings: The parameters you used (n=250, minfreq=46, etc.) influence the structure of the network. Experiment with different settings to see how the map changes. Increasing `community.repulsion` might separate the clusters more distinctly.
- Database Bias: The analysis is based on SCOPUS data. Consider whether this database adequately represents all relevant research in the field. Would including data from other databases (e.g., Web of Science, PubMed) change the results?
- Temporal Trends: Consider performing the analysis on different time slices to see how the themes have evolved over time. Is “Data Sharing” becoming more central, or is “Privacy” gaining more attention?
- Normalization: While pagerank is useful, explore other centrality measures (e.g., betweenness centrality) to get a more complete picture of node importance.
Recommendations for Further Analysis
1. Qualitative Analysis: Conduct a deeper qualitative analysis of the most central articles in each cluster to understand the specific research questions, methodologies, and findings.
2. Citation Analysis: Explore the citation patterns between clusters. Are there significant citations from the “Human” cluster to the “Privacy” cluster (or vice-versa)? This can reveal how these themes influence each other.
3. Keyword Co-occurrence Analysis: Perform a more detailed keyword co-occurrence analysis within each cluster to identify the most frequent combinations of keywords. This can help to refine the definition of each theme.
4. Compare with Other Fields: Compare this strategic map to those generated for related fields to identify similarities and differences in the intellectual structure.
By considering these points and conducting further analyses, you can gain a more nuanced understanding of the research landscape and identify potential areas for future research. Remember to always critically evaluate your findings and consider the limitations of your data and methods.
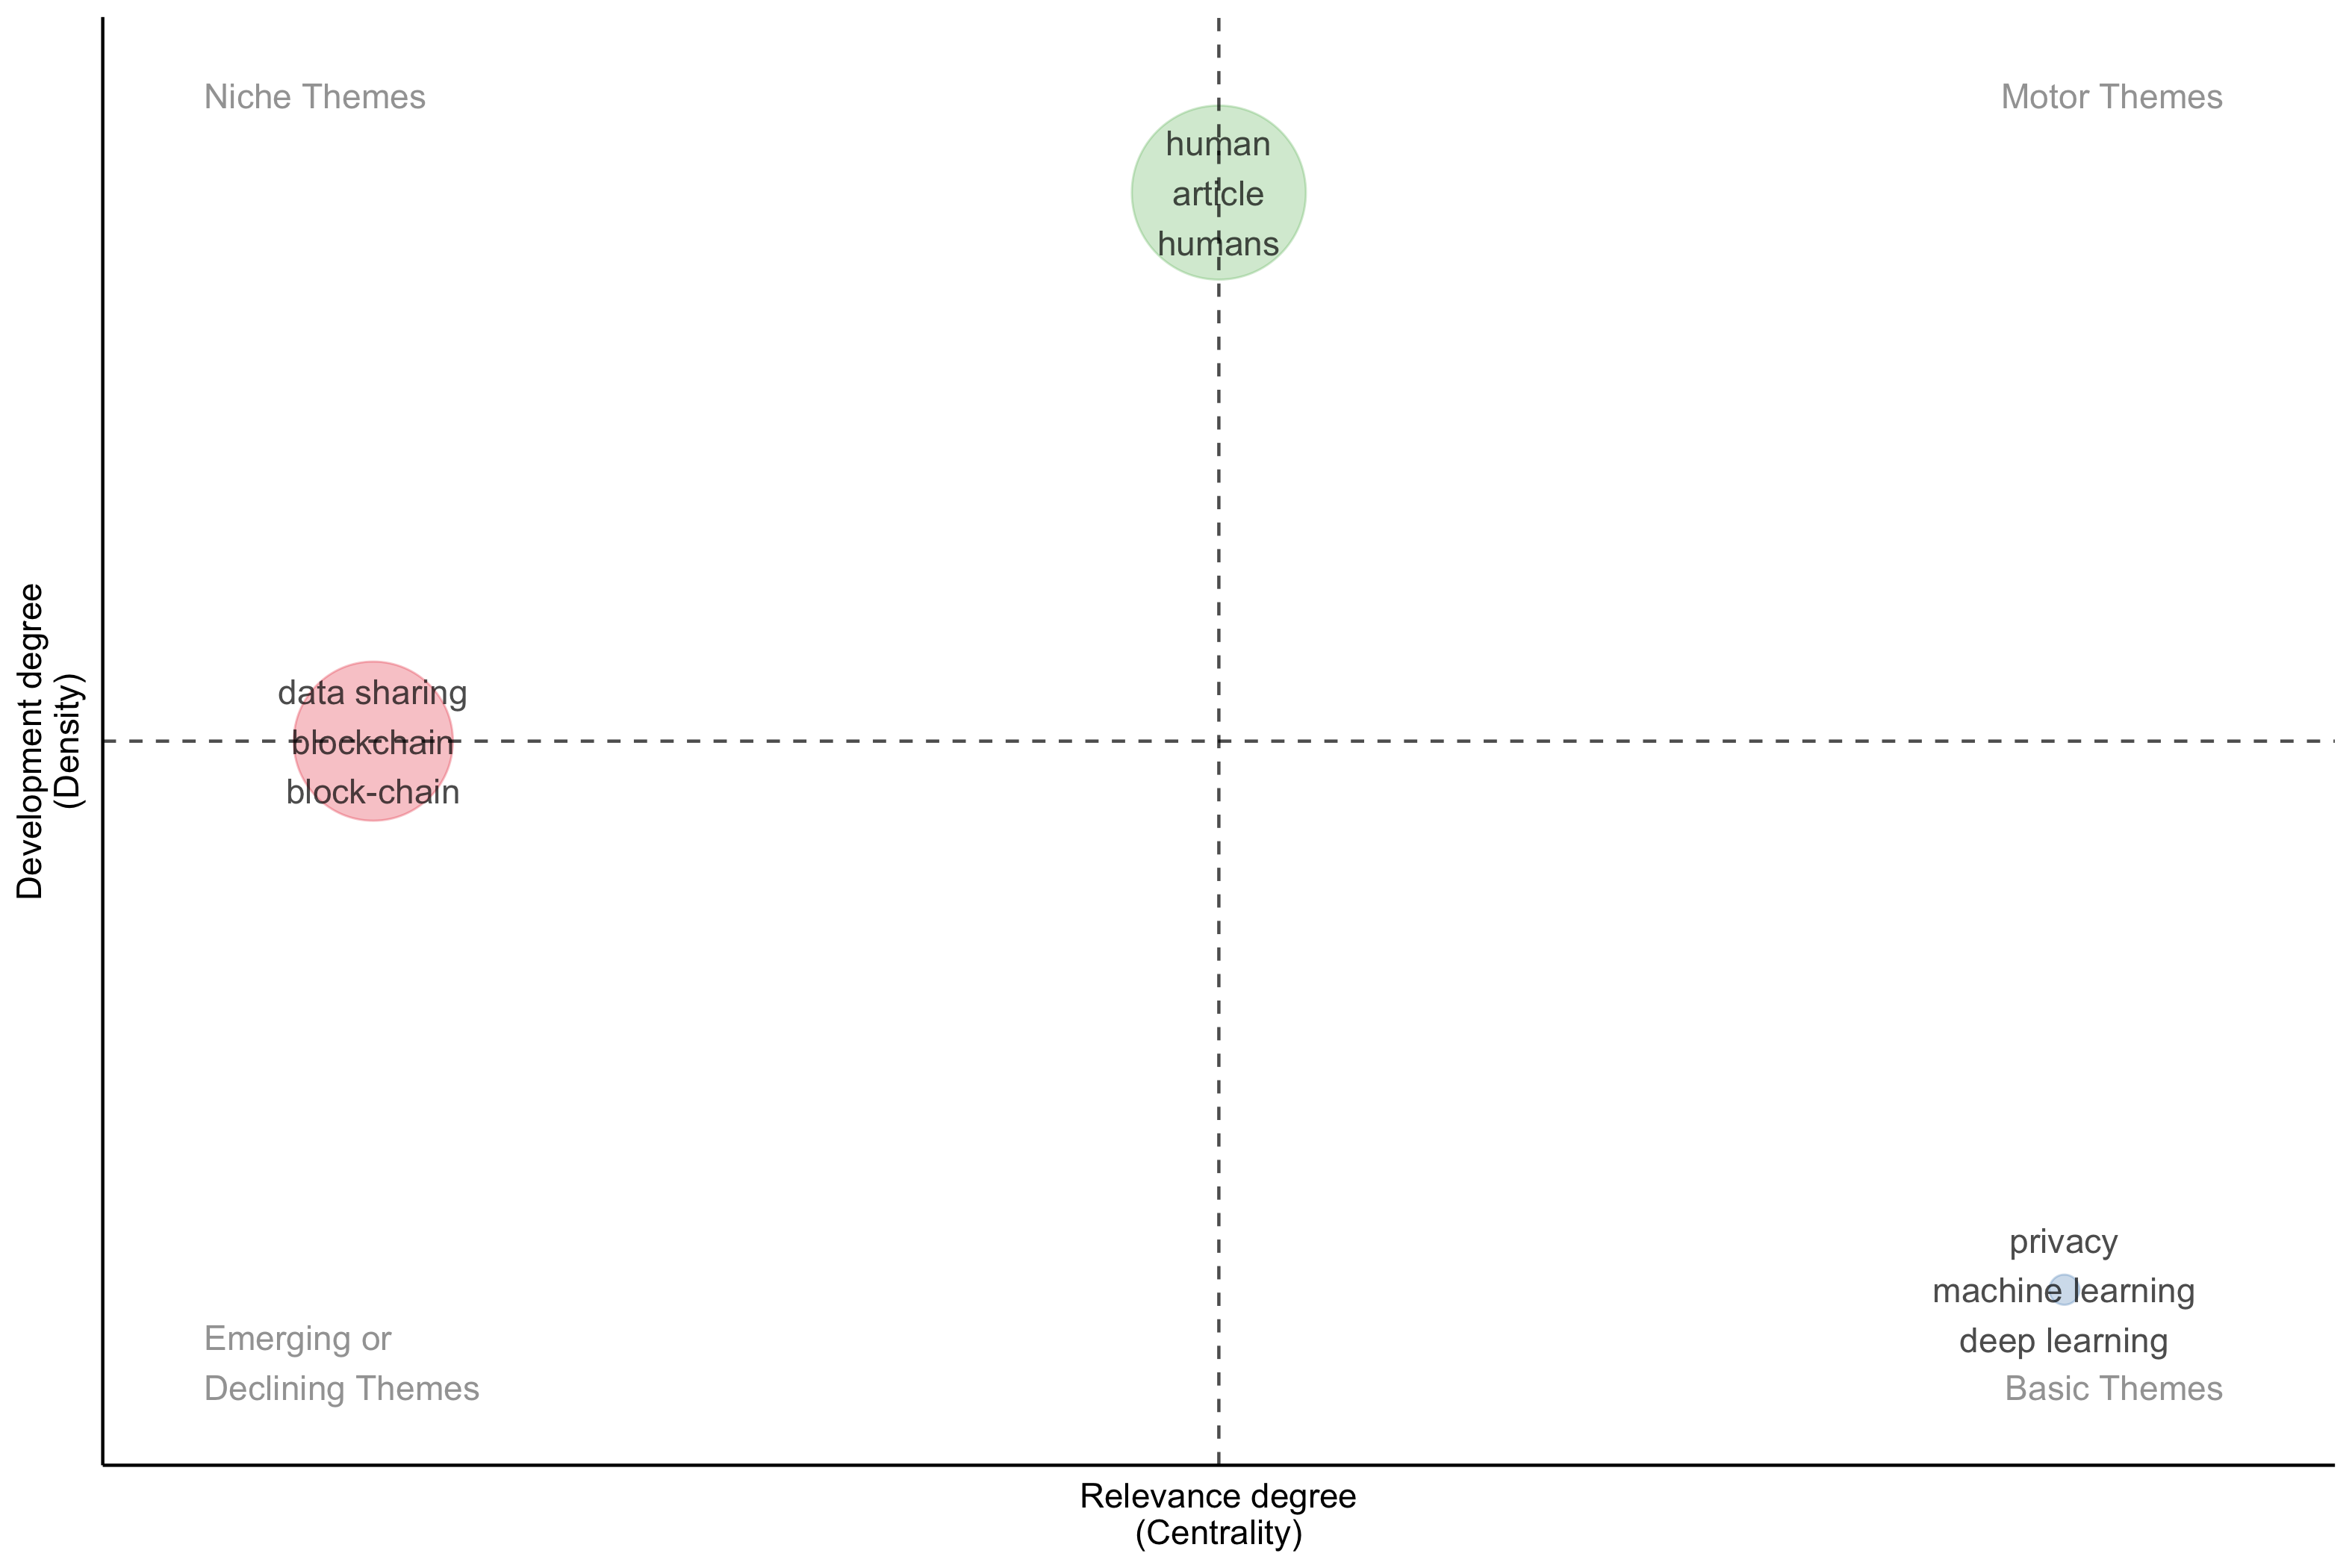
Factorial Analysis
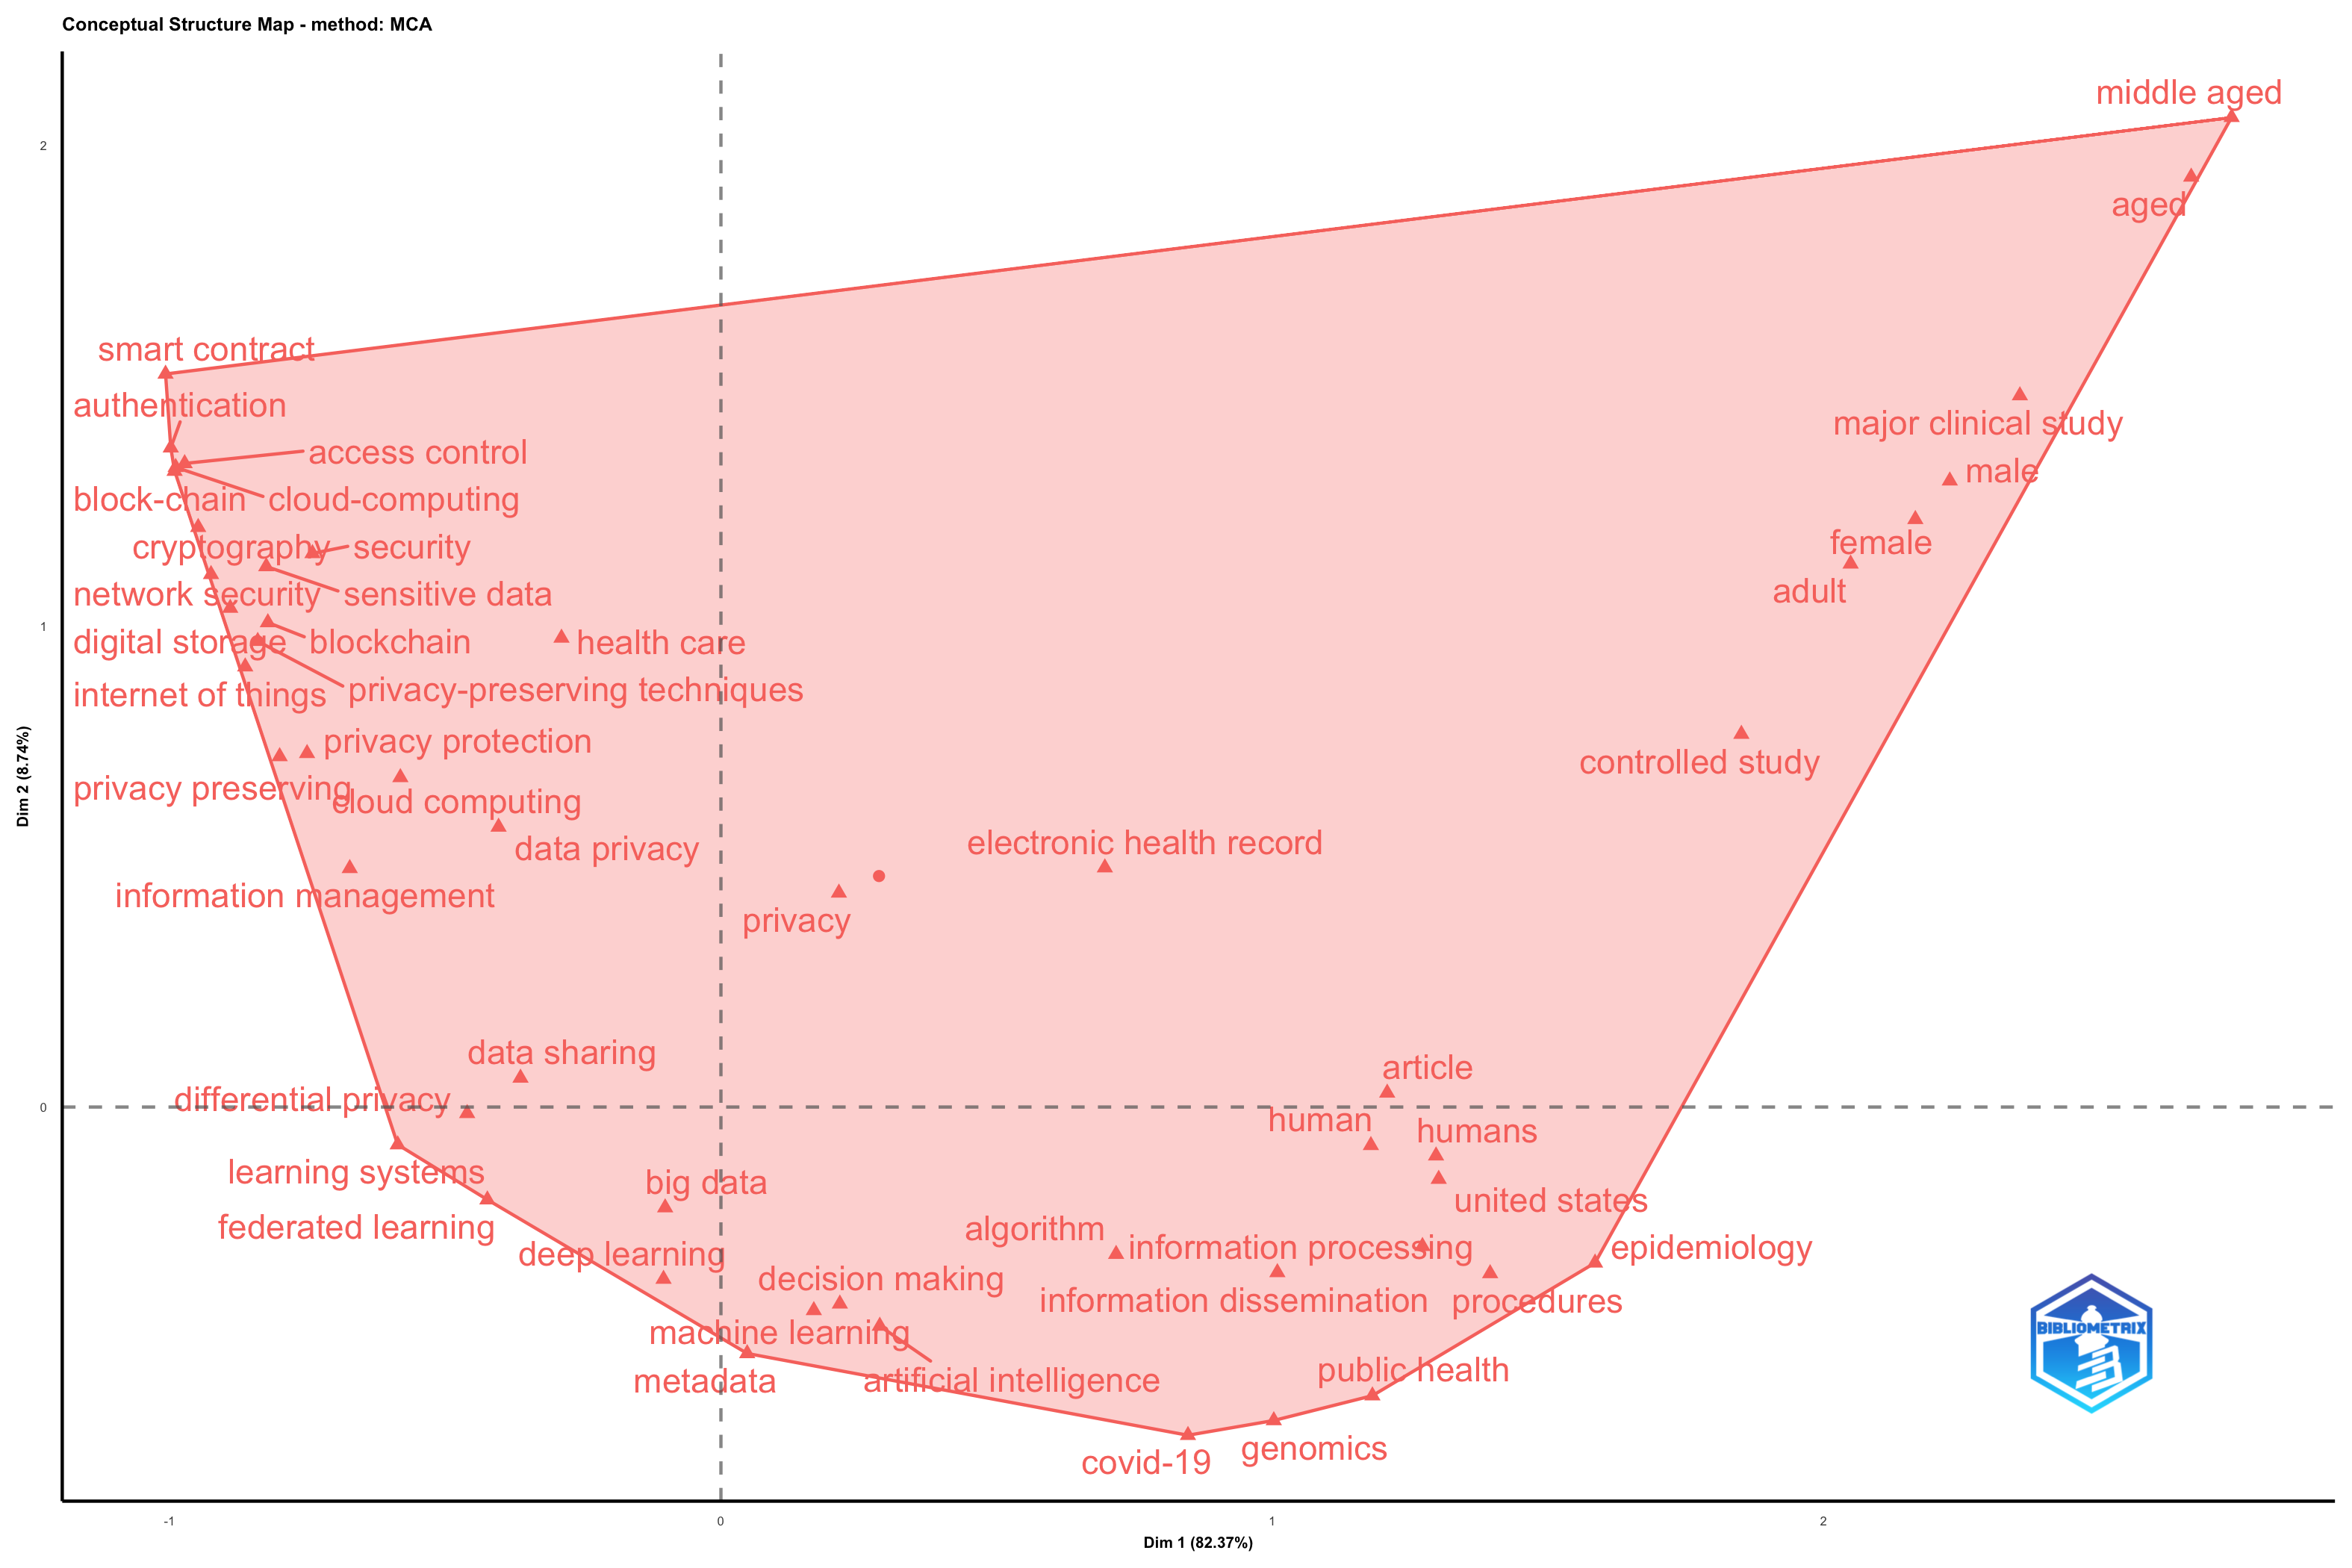
Okay, let’s analyze this factorial map derived from the bibliometric analysis of your SCOPUS dataset. The map is generated using Multiple Correspondence Analysis (MCA) on merged keywords (KW_Merged), with a minimum keyword degree of 221. This means only keywords appearing frequently enough (>=221 times) are included. The analysis uses unigrams (ngrams=1), no stemming (stemming = FALSE), and identifies clusters using a maximum of 8 clusters (k.max = 8), though with `clust=1` parameter, only one cluster will be drawn on the map. The plot shows only the first two dimensions (Dim 1 and Dim 2), which explain 82.37% and 8.74% of the total variance, respectively.
Here’s a breakdown of the interpretation:
1. Overall Structure:
- Dimension 1 (82.37%): This dimension accounts for the vast majority of the variance. Keywords positioned further to the right on Dim 1 are strongly associated with one aspect of the research, while keywords on the left are associated with a contrasting aspect.
- Dimension 2 (8.74%): This dimension captures a smaller but still relevant portion of the variance. It represents a different dimension of differentiation among the keywords.
2. Keyword Clusters and Interpretation:
The map shows how different keywords relate to each other based on their co-occurrence in the publications within your SCOPUS dataset.
- Cluster 1: Blockchain & Data Privacy (Upper Left): Keywords like “block-chain,” “blockchain,” “health care,” “data privacy,” and “information management” form a cluster in the upper left quadrant. This suggests a strong research focus on the application of blockchain technology in healthcare for improved data privacy and information management. The proximity of “health care” further reinforces this interpretation.
- Cluster 2: AI & COVID-19 (Central): Keywords like “deep learning”, “artificial intelligence”, “metadata” and “covid-19” are clustered together. This suggests research focused on AI and machine learning techniques, potentially for analyzing data related to the pandemic, as well as using metadata to manage and process such data.
- Cluster 3: Epidemiology & Human Studies (Central to Right): Keywords like “human”, “epidemiology” and “information dissemination” suggest studies related to epidemiological characteristics of the populations included in the studies.
- Cluster 4: Aging Studies (Top Right): Keywords such as “middle aged” and “aged” are in the upper right quadrant, meaning a specific focus on studies relating to elderly people. The co-occurence with the term “male” suggests the gender is important in this set of documents.
- Bridging terms “electronic health record”, “privacy” and “controlled study”
3. Key Takeaways and Potential Research Questions:
- Dominant Themes: The strong loading of Dim 1 (82.37%) indicates that a large proportion of the research in this dataset is driven by a clear overarching theme. Based on the keyword positions, that theme seems to be related to the application of emerging technologies (like blockchain and AI) in health-related research.
- Data Privacy and Security in Healthcare: The “block-chain” and “data privacy” cluster highlights the importance of data security and privacy considerations within healthcare research. This is a timely topic given increasing concerns about data breaches and the need to protect sensitive patient information.
- AI for COVID-19: The association between AI-related keywords and “covid-19” emphasizes the role of artificial intelligence and machine learning in addressing the pandemic. This could involve applications like predicting disease spread, identifying potential treatments, or analyzing patient data.
- The relationship between epidemiology and AI The cluster suggests relationship between studies based on statistical methods with studies based on computer-based methods.
- The use of Electronic Health Records for data analysis. Privacy is an important aspect of this area.
4. Critical Discussion Points & Further Investigation:
- Limited Variance Explained by Dim 2: The relatively low variance explained by Dim 2 (8.74%) suggests that there might be other underlying dimensions not captured by this analysis. You might consider exploring other analysis methods or keyword combinations to reveal more nuanced relationships within your data.
- Keyword Specificity: The analysis uses broad keywords. Consider whether using more specific keywords or phrases could provide a more refined understanding of the research landscape.
- Temporal Trends: This analysis provides a snapshot of the research landscape. Consider analyzing the data over time to identify emerging trends or shifts in research focus.
- Database Specificity: The analysis is based on SCOPUS data. Consider comparing the results with analyses based on other databases (e.g., Web of Science) to assess the generalizability of your findings.
- Missing information due to minDegree. The `minDegree` parameter of 221 is quite high. This means that many keywords with lower frequency are excluded. While this helps to focus on the most prominent themes, it could also lead to overlooking some relevant sub-themes or emerging areas of research. You might experiment with a lower `minDegree` value to see if it reveals additional insights, but be mindful of potential noise.
In summary, this factorial map provides a valuable overview of the key research themes and relationships within your SCOPUS dataset. By carefully interpreting the clusters and considering the critical discussion points, you can gain a deeper understanding of the research landscape and identify potential areas for future investigation. Remember to consider the limitations of the analysis (e.g., database specificity, `minDegree` parameter) and supplement it with additional research and analysis as needed.
Co-citation Network
Overall Structure:
The network displays a modular structure, indicating the presence of several distinct research communities or subfields within your SCOPUS dataset. The fact that these communities exist suggests different research streams, methodologies, or application areas within the overarching topic. The relatively sparse connections between the clusters suggest that these areas, while potentially related, operate fairly independently.
Community Detection (Walktrap):
The Walktrap algorithm has identified several clusters, each represented by a different color. This algorithm tends to find communities that are easily reachable by random walks on the graph, which aligns with the idea of topical clusters.
- Green Cluster (Central): This appears to be the most central and densely connected cluster. Prominently features “Nakamoto S. 2008-1”, “Harris P.A.” and “Gubbi J.”. The dominance of this group suggests this might be a central or foundational area of research related to the dataset you analyzed.
- Blue Cluster: Heavily connected with the Green Cluster and includes “Nakamoto S. 2008-2”, “Sahai A. 2005”, “Levko A.” “Bethencourt. 2007”. Its proximity to the green cluster and shared nodes suggest a close relationship, perhaps representing a specific theoretical development, application, or extension of the green cluster’s core ideas.
- Purple Cluster (Right): Appears to be more recent, with more recent publications with “Lu Y. 2020-1” and “Zhao Y. 2018”. This suggests that this area is a more recent development.
- Red Cluster (Top Left): Features “Regulation (EU)” and “Directive (EU)”. This suggests that regulation and directives within the European Union is another main topic that is investigated in your collection.
- Brown Cluster (Bottom): Includes “Braun V. 2006-1” and “Borgman C.L. 2012” are grouped here. This could represent a specific application area, methodology, or a group of researchers who consistently cite each other.
- Orange Cluster (Left): Very isolated. Only “Tong A.” is present here. Its isolation indicates a very specific and perhaps niche area of research that is only weakly connected to the other clusters.
- Grey Cluster (Bottom Left): Relatively isolated. Features “Intelligent transport systems (its). Vehicular communications.”. This cluster shows that intelligent transport systems (ITS) and vehicular communications is another topic that appears in your collection.
Most Connected Terms and Their Relevance:
- Nakamoto S. 2008-1 and Nakamoto S. 2008-2: The prominence of these publications suggests they are foundational works within this area of research. Depending on the context of your dataset, this could indicate topics related to blockchain, distributed systems, or cryptography, as the Nakamoto papers are seminal in those fields. The fact that “Nakamoto S. 2008-1” is particularly dominant suggests that the original paper is more widely cited than subsequent works by the same author or on related topics.
- Regulation (EU): The presence of this suggests an important consideration of regulatory and legal frameworks. It might highlight the importance of policy and governance in the research area.
Interpretation Guidance & Critical Discussion Points:
1. Topic Identification: The clusters identified provide a starting point for understanding the key research themes within your dataset. Investigate the content of the most highly cited papers within each cluster to determine the core topics, methodologies, and applications that define each research community.
2. Community Relationships: Explore the connections between clusters. Are there any bridging papers or concepts that link different research areas? A lack of connection might reveal potential gaps or missed opportunities for cross-disciplinary collaboration.
3. Temporal Trends: Given that the network displays publications from a range of years, consider how the prominence of different clusters has changed over time. Has the “purple cluster” risen in prominence more recently? Are other clusters declining in influence? This can tell you about the evolution of the field.
4. Database Bias: Remember that your analysis is based on data from SCOPUS. This database has its own coverage characteristics. Consider whether the results would be different if you had used Web of Science, Google Scholar, or a combination of databases. Also, consider the language biases within SCOPUS.
5. Parameter Sensitivity: The network structure is sensitive to the parameters used in the analysis (e.g., the `community.repulsion` parameter, which controls how much the communities push each other apart). Experimenting with different parameter settings can reveal different aspects of the network structure.
6. Limitations of Co-citation: Co-citation is based on the assumption that papers cited together are related. While this is often true, there can be exceptions (e.g., a paper might cite two unrelated works to contrast different approaches).
By critically examining the network structure, the composition of the clusters, and the key publications within each community, you can gain valuable insights into the intellectual landscape of your research area. Remember to consider the limitations of the data and the analysis methods, and to triangulate your findings with other sources of information. Good luck!
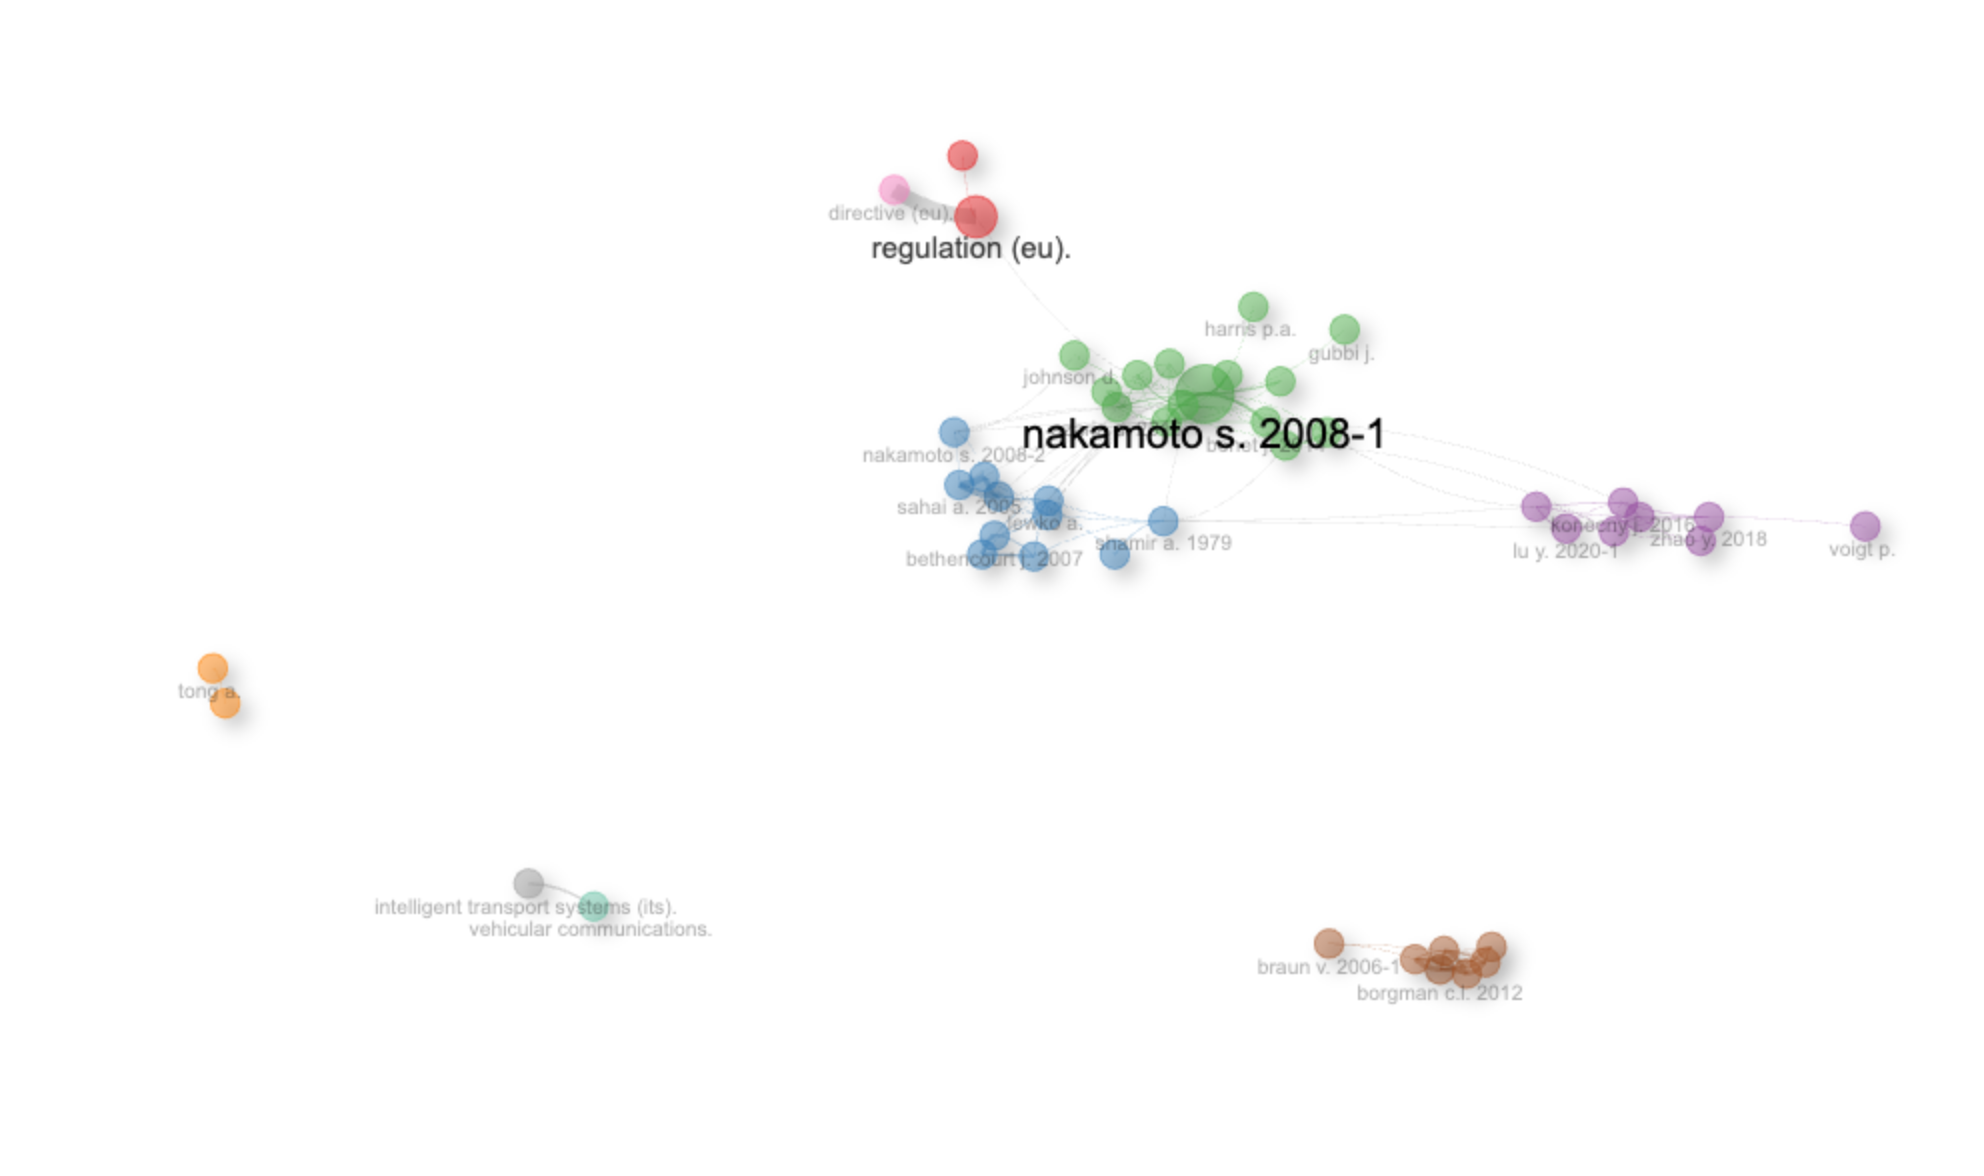
Historiograph
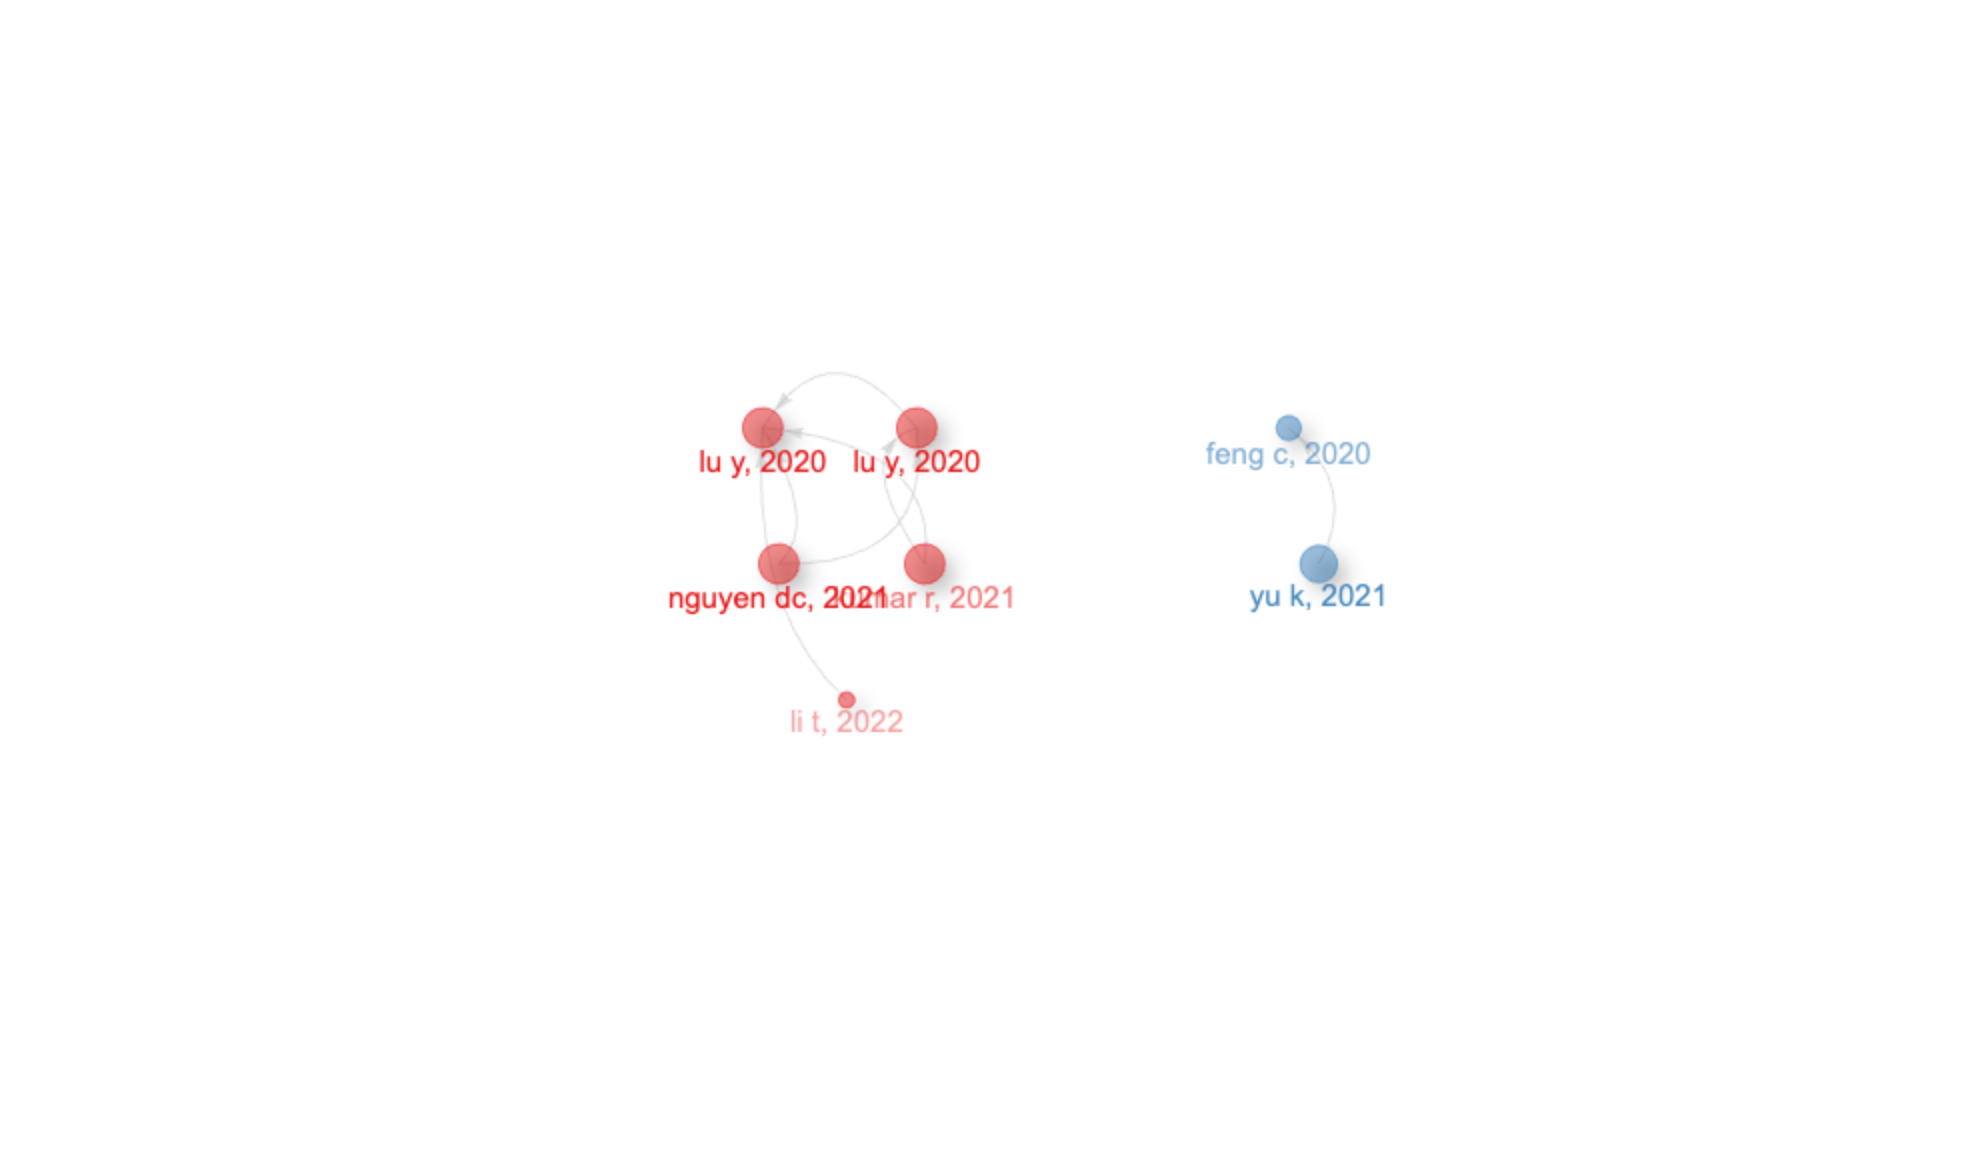
Collaboration Network
Overall Structure and Communities
- Two Distinct Communities: The most striking feature is the clear separation of the network into two primary communities (represented by blue and red nodes). This suggests that the researchers in your dataset tend to collaborate within these two groups, with less frequent collaborations across them. This division *could* represent different subfields, methodologies, geographic locations, or even institutional affiliations within your research domain. It’s worth investigating the authors within each community to understand the basis for this division.
- “Walktrap” Clustering: The `walktrap` algorithm emphasizes community structure based on random walks. This means that the algorithm identified groups of authors that are more easily reached by randomly “walking” through the collaboration network than authors outside the group. This is a fairly robust method for detecting communities.
- Inter-Community Links: The gray links connecting the two communities are crucial. These represent collaborations between authors from the different groups. The thickness of these lines indicates the strength (frequency) of collaboration. While the communities are largely distinct, there *is* some degree of collaboration bridging the gap. Identifying the authors involved in these inter-community collaborations could be valuable. They might be acting as “brokers” of knowledge or expertise between the groups.
Interpretation of Specific Authors
* Node Size: Node size in this graph represents the *degree centrality* of a node, indicating the number of direct collaborators each author has. Larger nodes represent more central and influential authors within the network.
* Most Connected Authors (Labels): The visualization highlights the 50 most connected authors in the network (using `label.n=50`). Let’s consider a few of the most prominent ones based on label size:
* Within the Blue Community: `zhang y`, `liu y`, `wang y`, `wang j`, `zhang x`
* Within the Red Community: `li y`, `wang x`, `zhang j`, `wang h`, `xu s`, `huang x`
These authors appear to be central figures in their respective communities. They likely play a significant role in shaping research trends and disseminating knowledge within their groups.
* “Names” (Possible Interpretations): I see names that could belong to authors with Chinese names: Zhang, Liu, Wang, Li, Chen, Yang, Xu and Huang. It is common to see that in many fields of research specific countries and/or groups work together, this could indicate some scientific collaboration between Chinese universities or research centers.
Interpretation of the Network Parameters
- `normalize = “association”`: This setting means that the co-occurrence of authors (i.e., their collaboration on papers) is normalized using the association strength. Association strength is a measure of how much more frequently two authors collaborate than would be expected by chance. It emphasizes statistically significant co-authorships.
- `remove.isolates = TRUE`: This is important as it cleans up the graph from authors with no connections to others, and therefore they are not important for the collaboration analysis.
Critically Discussing the Results
1. Data Limitations: The analysis is based on SCOPUS data alone. Are there other relevant databases (Web of Science, Google Scholar) that might provide a more complete picture of author collaborations? The choice of SCOPUS influences which authors and publications are included, and therefore the resulting network.
2. Collaboration vs. Influence: While this network visualizes *collaboration*, it doesn’t directly measure *influence*. Highly collaborative authors aren’t necessarily the most impactful in terms of citations or groundbreaking ideas.
3. Temporal Dynamics: This is a static snapshot of collaboration. How has this network evolved over time? Are the communities stable, or are authors moving between them? Have new influential authors emerged?
4. Discipline-Specific Considerations: The interpretation needs to be grounded in the specific research field. What are the typical collaboration patterns in this field? Is this level of community separation common? Are there known rivalries or competing schools of thought that might explain the structure?
5. Community Quality: The “walktrap” algorithm finds communities, but are these communities *meaningful*? Do the authors within each community share research interests, methodologies, or theoretical perspectives? Further qualitative analysis of their publications is needed to validate the communities identified.
Next Steps for the Researcher
1. Investigate Community Themes: Analyze the keywords, abstracts, and journals associated with publications from each community. What are the main research themes of each group? This will provide context for the community structure.
2. Examine Inter-Community Papers: Focus on the publications resulting from collaborations between the two communities. What topics are being addressed in these cross-community collaborations? Do these papers represent novel research directions or attempts to bridge different perspectives?
3. Consider Temporal Analysis: Create collaboration networks for different time periods to see how the structure evolves.
4. Qualitative Analysis: Conduct interviews with some of the key authors to understand their collaboration strategies and perspectives on the research landscape.
By critically evaluating the network structure, considering the parameters used, and exploring the content of the publications, you can move beyond a simple visualization and gain deeper insights into the dynamics of research collaboration in your chosen field. Let me know if you would like me to elaborate on any of these points.