Overall Assessment:
This bibliographic collection appears to represent a rapidly growing and impactful body of research. The high annual growth rate, coupled with a relatively short average document age, suggests that the field is dynamic and experiencing significant recent activity. The average citations per document indicates a considerable impact, and the collaborative nature of the research further reinforces its significance.
Detailed Interpretation:
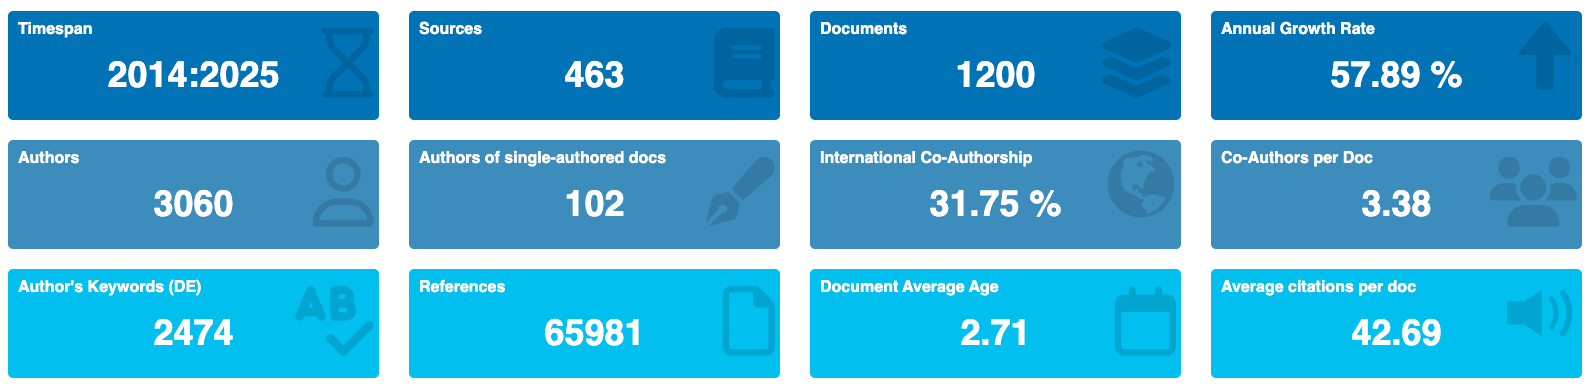
- Timespan (2014-2025): Covering publications from 2014 to 2025 (assuming the current year), this provides a good recent snapshot of the field. The inclusion of 2025 suggests that the analysis might have been performed at the beginning of the year (or includes publications ahead of the current date depending on SCOPUS indexing practices).
- Sources (Journals, Books, etc.): 463: The presence of 463 different sources indicates a diverse range of outlets contributing to this field. This suggests the research area isn’t confined to a few core journals but draws upon knowledge disseminated across a variety of academic publications. This breadth may also suggest interdisciplinary nature. It might be useful to investigate *which* sources are most prominent.
- Documents: 1200: A collection of 1200 documents represents a substantial body of literature, offering a solid foundation for analysis.
- Annual Growth Rate %: 57.89: This is a very high annual growth rate, signaling a rapidly expanding field. This could be due to emerging technologies, increased funding, or a shift in research focus towards this area. It’s essential to investigate the factors driving this rapid expansion.
- Document Average Age: 2.71: A very young average age suggests that the field is very active and that a significant proportion of the research is recent. This reinforces the high growth rate and implies that older publications are less influential (perhaps superseded by newer findings).
- Average Citations Per Document: 42.69: This is a very good average citation rate. It indicates that, on average, each document is being cited a significant number of times. This suggests the research within this collection is having a considerable impact and is being recognized by other researchers. This could be an area of active research, or the collection may be limited to a small amount of highly cited works.
- References: 65981: The large number of references indicates that the research builds upon a substantial foundation of existing knowledge. This is a sign of a well-established research area with extensive literature.
- Keywords Plus (ID): 3395 & Author’s Keywords (DE): 2474: These values are indicative of the variety of topics covered in the collection. The difference between Keywords Plus (generated by the database) and Author’s Keywords reflects the database’s interpretation versus the authors’ own descriptions of their work. Analysing these keywords could reveal the key themes and trends within the field.
- Authors: 3060: The number of authors suggests a relatively large community of researchers working in this area.
- Authors of Single-Authored Documents: 102 & Single-Authored Documents: 111: While there are single-authored documents, the vast majority are multi-authored (see co-authors below). The small proportion of single-authored documents might suggest a highly collaborative environment, although some fields may also have a high number of sole-authored documents.
- Co-Authors Per Document: 3.38: This statistic confirms the collaborative nature of the research. An average of 3.38 co-authors per document suggests that most projects involve collaboration among multiple researchers.
- International Co-Authorships %: 31.75: A significant percentage of international co-authorships indicates that the research is not confined to a single country but involves collaboration across borders. This promotes the exchange of ideas and expertise on a global scale and suggests the field’s relevance is widespread.
* Document Types (Article, Book, etc.):
* Article (721): Articles represent the majority of publications.
* Book (17) & Book Chapter (158): Indicating textbooks, comprehensive investigations, and focused explorations.
* Conference Paper (175) & Conference Review (10): Suggests an active community that exchanges ideas and results at conferences.
* Review (105): A good number of review papers indicates that there are efforts to synthesize and summarise the existing knowledge in this field. This is particularly important in a rapidly growing area.
* Other Types (Editorial, Erratum, Note, Retracted, Short Survey): The smaller number of these other document types provides additional context but are unlikely to significantly impact the overall interpretation. The presence of a retracted article is worth noting, but without further information, it’s difficult to assess its significance.
Critical Discussion Points and Further Investigation:
- Reasons for High Growth Rate: What are the specific drivers behind the impressive annual growth rate? Is it a truly new field, or is it a convergence of existing disciplines? Is there a large amount of funding going into this field?
- Source Analysis: Which journals or sources are the most prominent in this collection? Are there any key journals that consistently publish influential research in this area?
- Keyword Analysis: Performing a deeper analysis of the keywords would help identify the core research themes, emerging trends, and potential gaps in the literature.
- Citation Analysis: Investigating the most highly cited papers and their impact on the field would provide valuable insights into the key contributions and influential researchers.
- Geographic Distribution: Beyond international co-authorships, analyze the geographic distribution of authors to understand which countries or regions are most active in this field.
- Limitations of SCOPUS: Remember that this analysis is based solely on data from SCOPUS. This database has coverage biases and may not include all relevant publications, especially those in languages other than English or those published in less prominent journals.
By exploring these questions and delving deeper into the data, you can gain a more comprehensive and nuanced understanding of the research landscape in this field. Good luck!
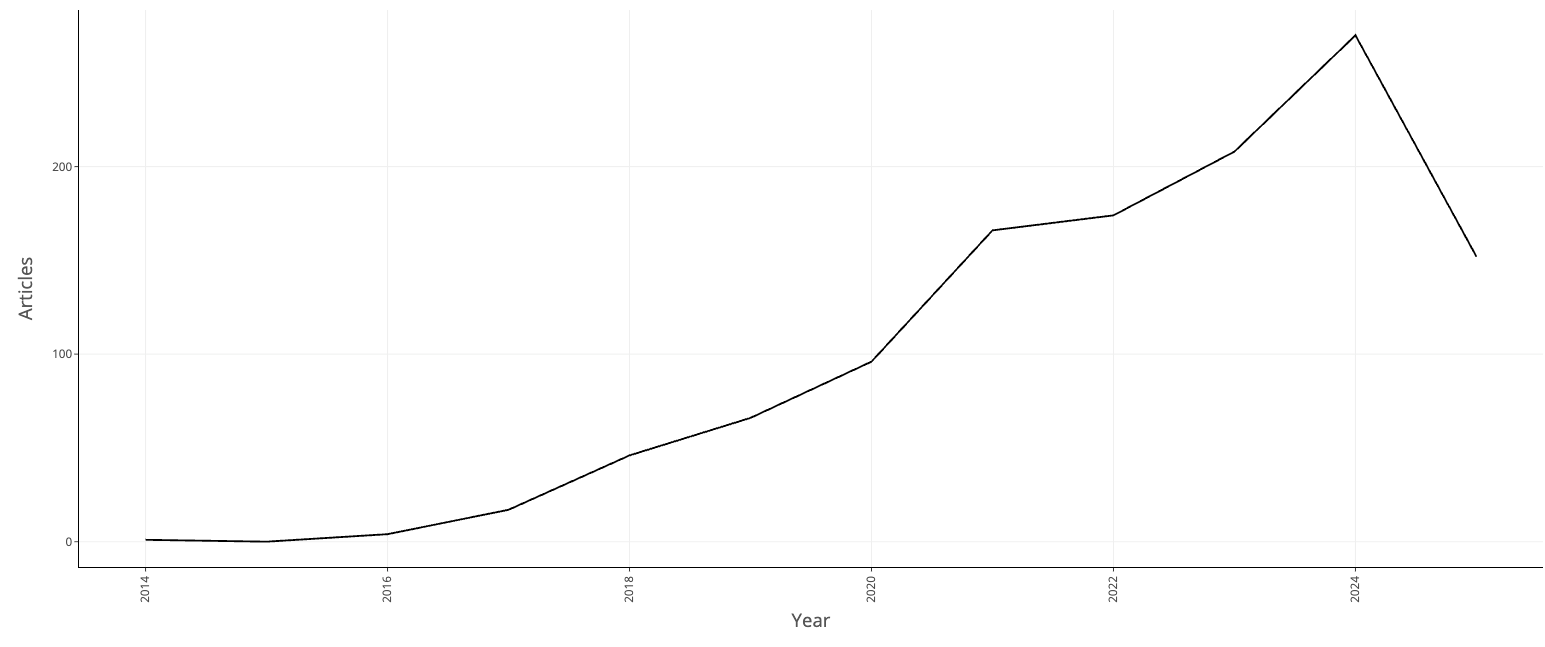
Annual Scientific Production
| 2014 | 1 |
| 2015 | 0 |
| 2016 | 4 |
| 2017 | 17 |
| 2018 | 46 |
| 2019 | 66 |
| 2020 | 96 |
| 2021 | 166 |
| 2022 | 174 |
| 2023 | 208 |
Three-Field Plot
Overall Structure and Interpretation
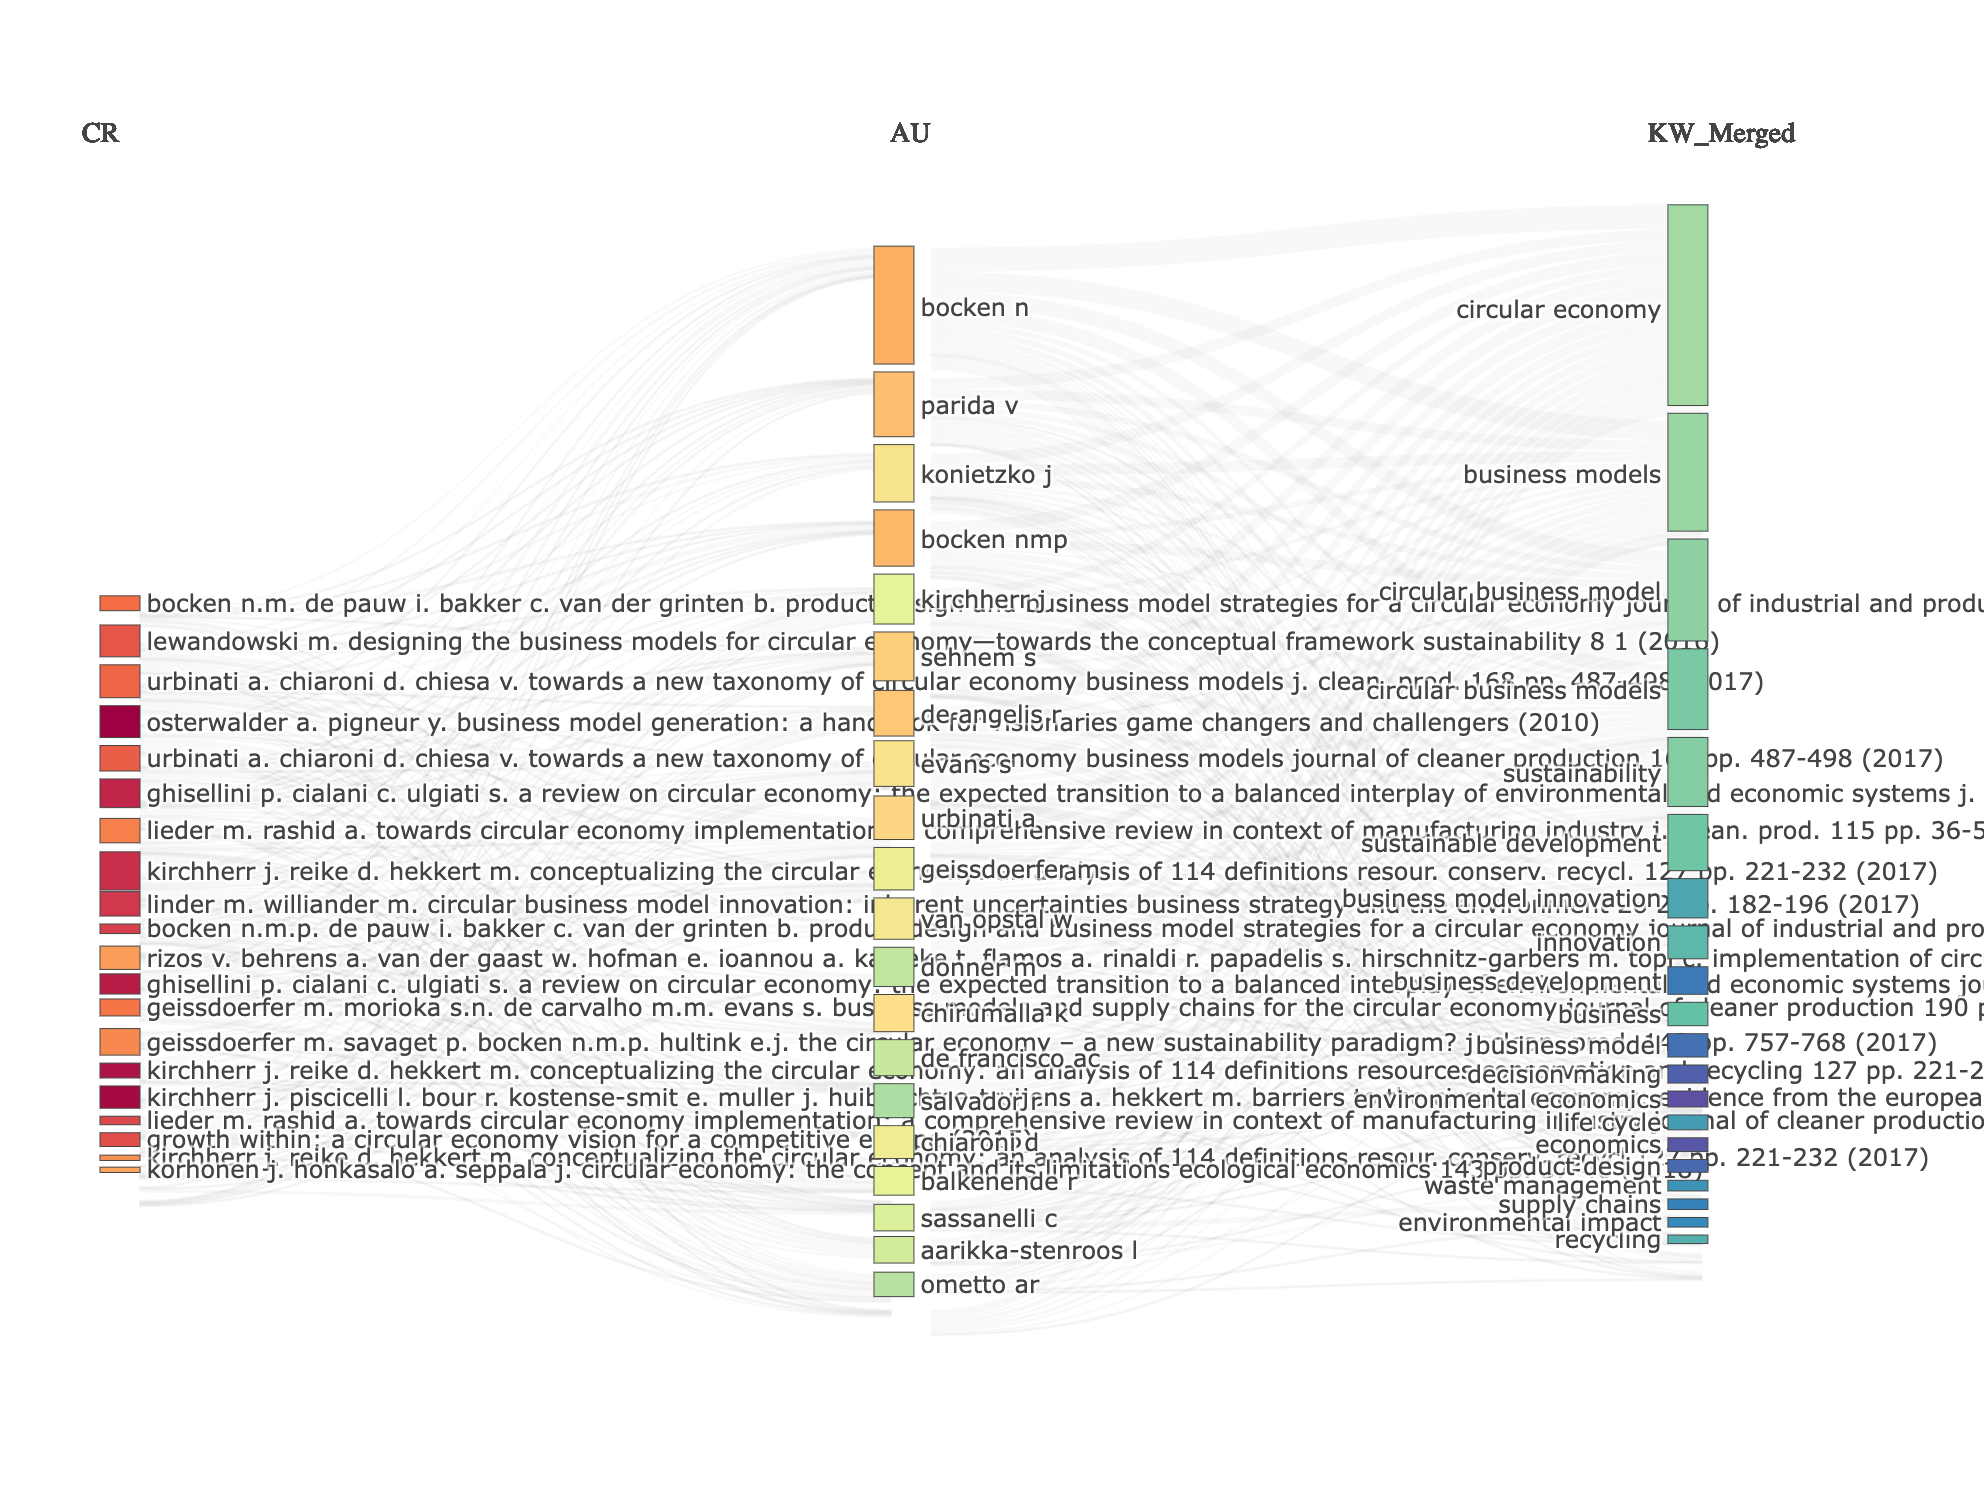
The three-field plot visualizes connections between the three metadata categories you chose. The thickness of the lines connecting the fields indicates the strength or frequency of the relationship between those specific elements. A thicker line means a more frequent association. In this case, it helps us understand:
- Which authors (AU) cite which references (CR).
- Which authors (AU) are associated with which keywords (KW_Merged).
- Inferentially, which cited references (CR) are associated with which keywords (KW_Merged), *through* their common connection to authors.
Field-by-Field Analysis
- Authors (AU – Central Field): This is the core of your analysis. The plot shows which authors are most active (or at least most represented) in your dataset. Authors appearing higher up generally have more connections, indicating that they are cited more, or the number of publications is higher than the authors that appear lower in the graph. Look for prominent authors like “bocken n,” “parida v” “konietzko j”, “bocken nmp.” These authors likely have a substantial body of work related to your research topic.
- Cited References (CR – Left Field): This field shows the foundational literature your authors are drawing upon. Some key cited references appearing are: “bocken n.m. de pauw i. bakker c. van der grinten b. product”; “lewandowski m. designing the business models for circular e”; “urbinati a. chiaroni d. chiesa v. towards a new taxonomy of.” References appearing higher up are commonly cited, indicating their influence in the research area.
- Keywords (KW\_Merged – Right Field): This field represents the major themes and topics covered by the authors in your dataset. The keyword “circular economy” seems to be very strong, as indicated by its significant connection to multiple authors and cited references. Other prominent keywords include “business models”. The colors indicate sub-clusters within these broader themes.
Key Observations and Insights
1. “Circular Economy” is a Dominant Theme: The very thick connection between the “circular economy” keyword and many authors shows that is a major focus of this research area. This is also highlighted by the presence of several references, such as “lieder m. rashid a. towards circular economy implementation”, “ghisellini p. cialani c. ulgiati s. a review on circular economy”
2. Author Clusters and Specialization: Look at the lines connecting authors to keywords. Are certain authors more strongly associated with specific keywords than others? For example, some authors may be more closely linked to “waste management,” while others focus on “sustainable development.” Understanding these clusters can reveal different sub-specialties within the broader field.
Next Steps for Critical Discussion
1. Identify Key Influences: Based on the cited references, discuss the theoretical or methodological foundations of the research in your area. Are there specific papers or authors who have significantly shaped the field?
2. Analyze Author Collaboration: While the plot doesn’t directly show co-authorship, you can infer potential collaborations based on shared cited references and keywords. Are there groups of authors who seem to be working on similar topics and citing the same sources?
3. Examine Keyword Trends: How have the keywords evolved over time (if your data includes publication years)? Are there emerging keywords that are becoming more prominent?
4. Compare and Contrast Perspectives: Based on the keyword associations, are there different schools of thought or approaches to the research problem?
Important Considerations When Interpreting Bibliometric Plots
- Data Limitations: This analysis is based on Scopus data. Different databases (Web of Science, Google Scholar) may yield slightly different results due to their indexing policies.
- Keyword Selection: The “KW_Merged” field suggests that you’ve already done some keyword cleaning and consolidation. The quality of your keyword analysis will significantly impact the interpretation of the plot.
- Context is Crucial: Bibliometric analyses are valuable, but they should always be interpreted in the context of your existing knowledge of the research area. Don’t rely solely on the plots to draw conclusions.
By carefully examining the connections and patterns in this three-field plot, you can gain valuable insights into the structure, key themes, and influential researchers in your field. Remember to use this analysis as a starting point for further investigation and critical discussion!
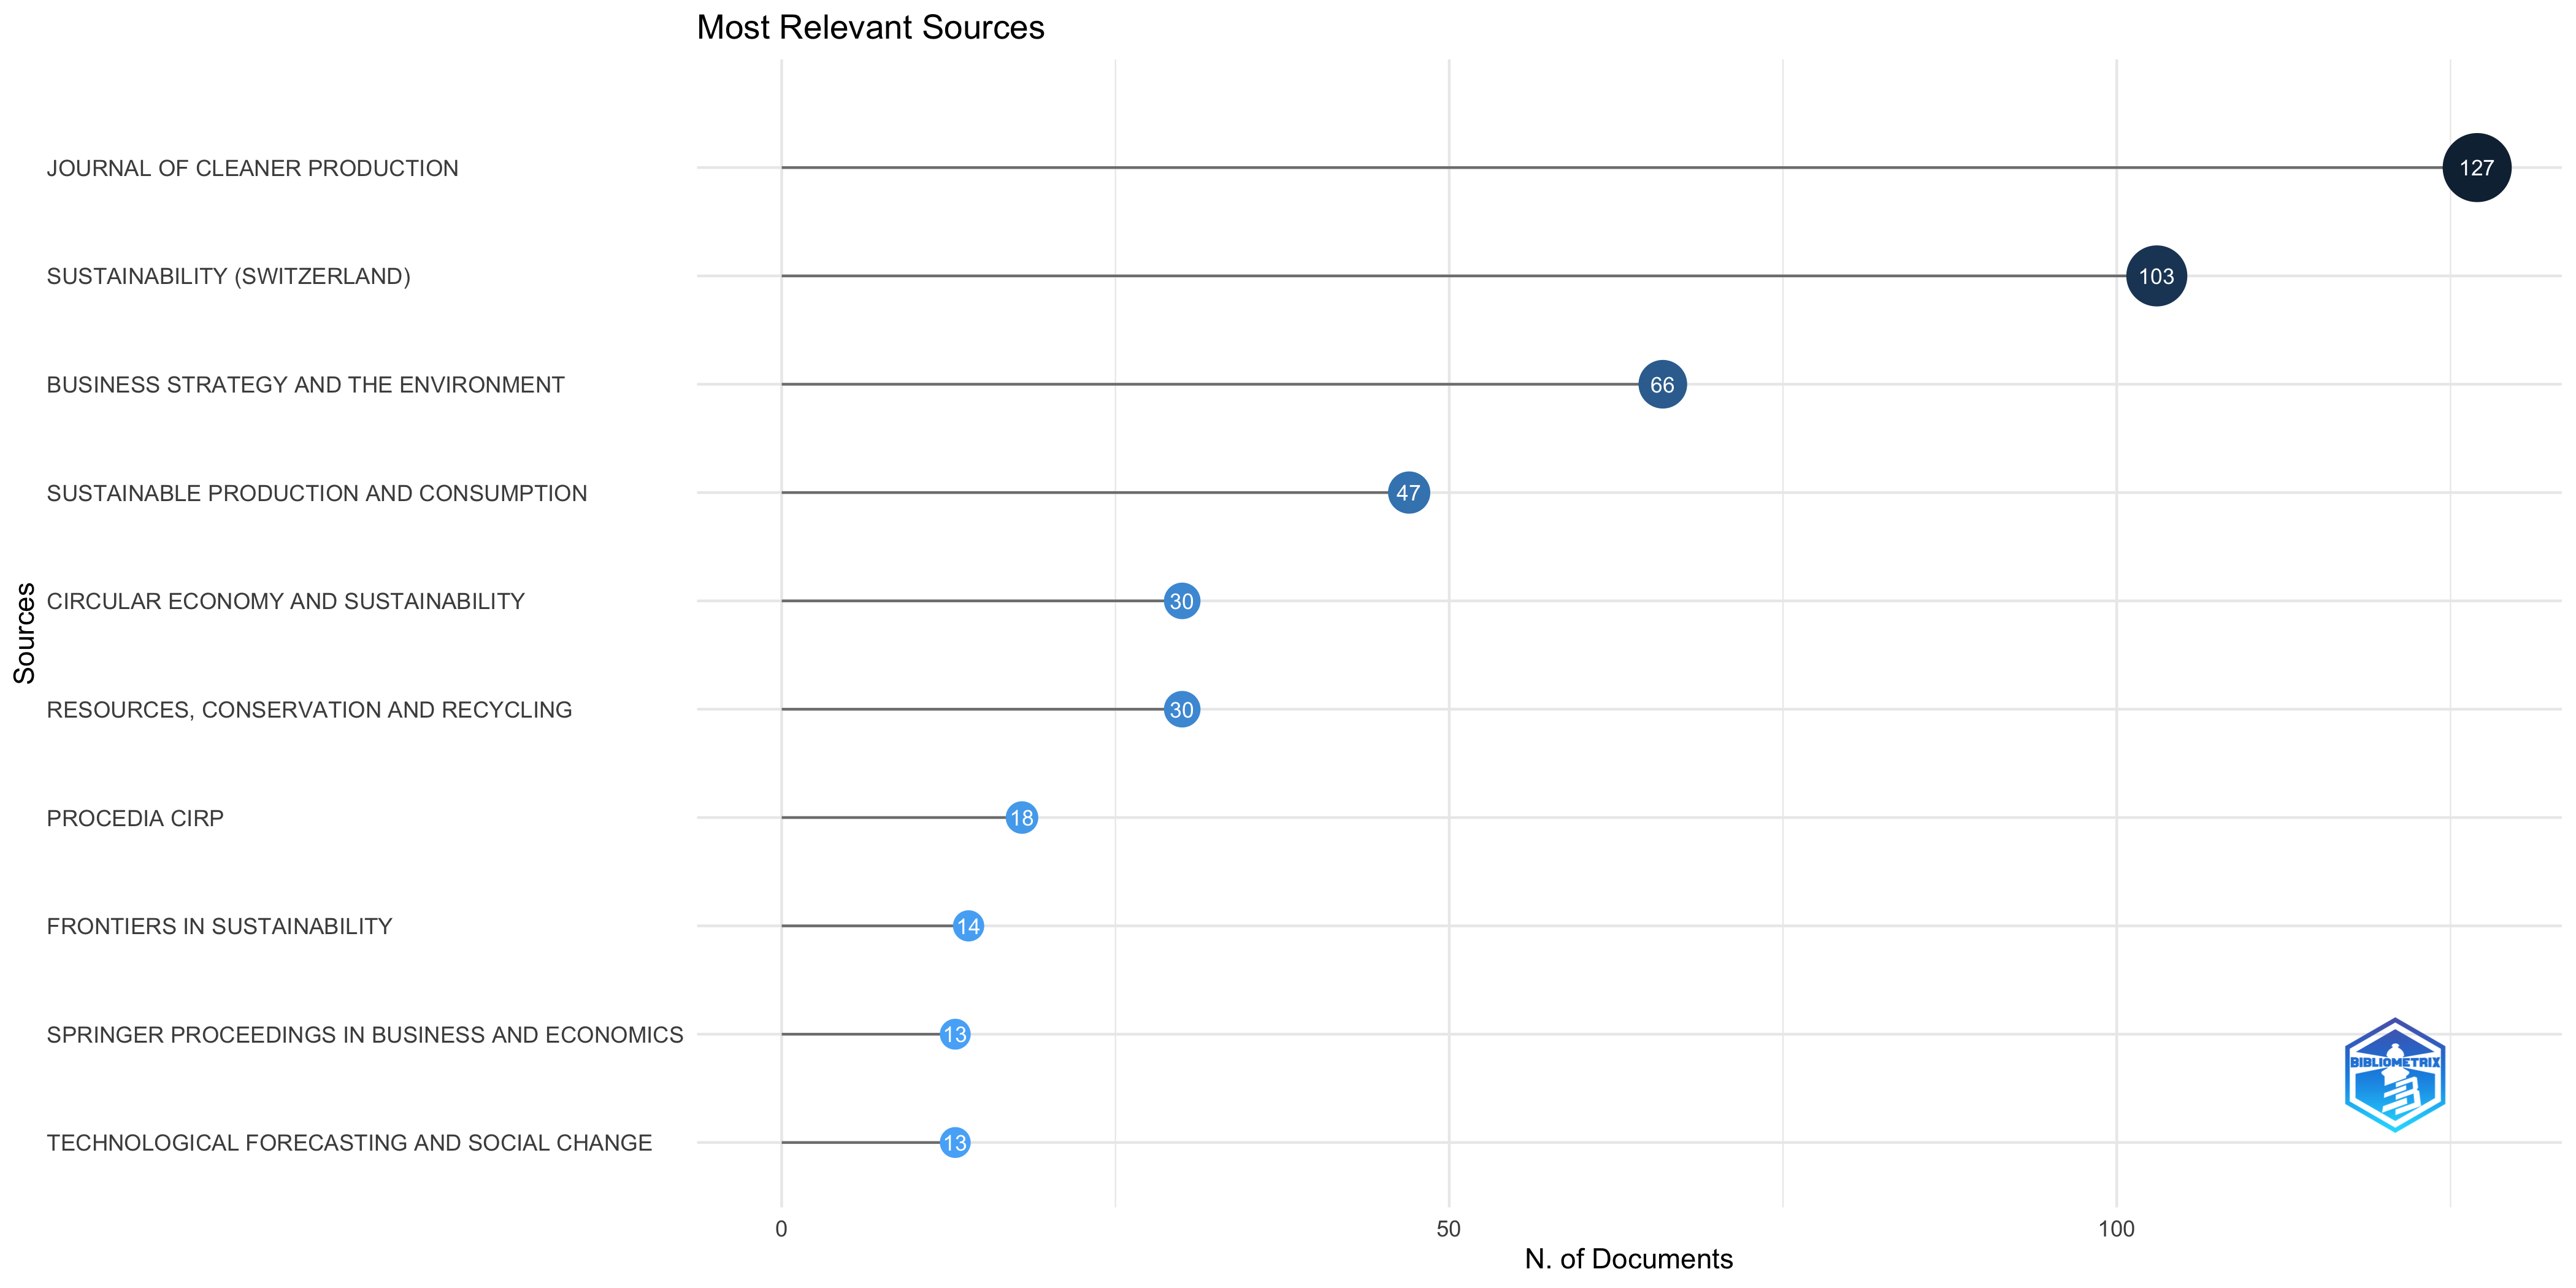
Most Relevant Sources
Sources’ Local Impact

Sources’ Production over Time

Most Relevant Authors

Authors’ Production over Time
Overall Interpretation:
The plot displays the research timelines of the top authors, indicating their publishing years and the quantity and impact (citations) of their work. The size of the bubbles represents the number of articles published in a specific year, while the color intensity reflects the total citations received by those articles in that year (TC/year). This allows us to observe trends in productivity and influence over time.
Individual Author Analysis:
Here’s a breakdown of observations for each author, integrating the information from both the plot and the list of highly cited articles:
- BOCKEN N: Bocken N has been active, particularly more recently, based on the image. Publications show a steady TC/year, with a peak in 2024 based on number of articles. Based on the top 3 cited-per-year, Bocken N has recent papers on: CIRCULAR ECOSYSTEM INNOVATION, CIRCULAR DIGITAL BUILT ENVIRONMENT, and A REVIEW AND EVALUATION OF CIRCULAR BUSINESS MODEL INNOVATION TOOLS. This shows an interest in ecosystem innovation, and circular business model development.
- BOCKEN NMP: Bocken NMP appears to have a publication peak around 2017/2018. Based on the top 3 cited-per-year, Bocken NMP has papers on: THE CIRCULAR ECONOMY – A NEW SUSTAINABILITY PARADIGM?, PRODUCT DESIGN AND BUSINESS MODEL STRATEGIES FOR A CIRCULAR ECONOMY, and EXPERIMENTING WITH A CIRCULAR BUSINESS MODEL. The initial paper indicates Bocken NMP may be seminal in laying the foundations of circular economy as a new sustainability paradigm.
- PARIDA V: Parida V has shown more recent activity (2022-2024), with consistent publishing and impact. Based on the top 3 cited-per-year, the author has publications on: LINKING CIRCULAR ECONOMY AND DIGITALISATION TECHNOLOGIES, ARTIFICIAL INTELLIGENCE ENABLING CIRCULAR BUSINESS MODEL INNOVATION, and CIRCULAR BUSINESS MODEL TRANSFORMATION. This indicates a focus on the intersection of circular economy, digitalization, and AI.
- DE ANGELIS R: De Angelis R’s publications are centered around 2018-2021, with some recent activity in 2024. Based on the top 3 cited-per-year, the author has publications on: SUPPLY CHAIN MANAGEMENT AND THE CIRCULAR ECONOMY, CIRCULAR ENTREPRENEURSHIP, and CIRCULAR ECONOMY AND PARADOX THEORY. This indicates research in supply chain management, and entrepreneurship.
- SEHNEM S: Sehnem S displays consistent research over the years. Based on the top 3 cited-per-year, the author has publications on: CIRCULAR ECONOMY AND INNOVATION, CIRCULAR BUSINESS MODELS, and IMPROVING STARTUPS THROUGH EXCELLENCE INITIATIVES. This indicates a strong focus on circular business models, innovation, and startups.
- URBINATI A: The author has research from 2019-2022. Based on the top 3 cited-per-year, the author has publications on: ENABLERS AND BARRIERS FOR CIRCULAR BUSINESS MODELS, COMPANIES’ CIRCULAR BUSINESS MODELS ENABLED BY SUPPLY CHAIN COLLABORATIONS, and VALUE CREATION IN CIRCULAR BUSINESS MODELS. This indicates research into the enablers and barriers to adoption, as well as value creation.
- CHIRUMALLA K: Chirumalla K’s publishing activity is concentrated in more recent years (2021-2024). Based on the top 3 cited-per-year, the author has publications on: ENABLING BATTERY CIRCULARITY, ROLE OF CUSTOMERS IN CIRCULAR BUSINESS MODELS, and MAPPING A CIRCULAR BUSINESS OPPORTUNITY IN ELECTRIC VEHICLE BATTERY VALUE CHAIN. There is a concentration on electric vehicle battery circularity, and the role of customers.
- EVANS S: Evans S has a peak in 2018. Based on the top 3 cited-per-year, the author has publications on: SUSTAINABLE BUSINESS MODEL INNOVATION, BUSINESS MODELS AND SUPPLY CHAINS FOR THE CIRCULAR ECONOMY, and PRODUCT-SERVICE SYSTEMS BUSINESS MODELS FOR CIRCULAR SUPPLY CHAINS. There is a research focus on business model innovation, and product-service systems.
- KONIETZKO J: Konietzko J has a stead stream of publications over time, with a high TC/year in 2020. Based on the top 3 cited-per-year, the author has publications on: CIRCULAR ECOSYSTEM INNOVATION, TOWARDS REGENERATIVE BUSINESS MODELS, and HOW DO COMPANIES MEASURE AND FORECAST ENVIRONMENTAL IMPACTS WHEN EXPERIMENTING WITH CIRCULAR BUSINESS MODELS?. The author has research into ecosystem innovation, and regenerative business models.
- VAN OPSTAL W: Van Opstal W’s research has taken place recently, from 2023 onwards. Based on the top 3 cited-per-year, the author has publications on: CIRCULAR ECONOMY STRATEGIES AS ENABLERS FOR SOLAR PV ADOPTION, STARTUPS AND CIRCULAR ECONOMY STRATEGIES, and WHEN DO CIRCULAR BUSINESS MODELS RESOLVE BARRIERS TO RESIDENTIAL SOLAR PV ADOPTION?. There is a research focus on adoption of solar PV, and the role of startups.
General Observations and Discussion Points:
- Evolution of the Field: The plot suggests a growing interest in Circular Economy research, with many authors showing recent publishing activity. This indicates the field is maturing and expanding.
- Citation Peaks: The color intensity highlights years where authors have had particularly impactful publications. Investigating these specific publications and the context surrounding them can provide insights into key developments and influential contributions in the field.
- Research Focus: By analyzing the titles of the most cited articles for each author, we can identify their specific areas of expertise and contribution to the broader field of Circular Economy. This can help researchers understand the diverse perspectives and approaches being taken.
- Potential Research Gaps: Observing the distribution of research across different years and authors might reveal potential gaps in the literature. Are there specific areas or time periods that are under-researched?
Critical Considerations:
- Database Bias: The analysis is based on SCOPUS data. Results might differ if another database (e.g., Web of Science) was used due to variations in indexing and coverage.
- Citation Window: Citations accumulate over time. More recent publications may not yet have had the opportunity to accrue as many citations as older publications, potentially underestimating their impact. TC/year attempts to address this, but it’s still important to keep the publication date in mind.
- Author Name Ambiguity: The analysis assumes correct author name disambiguation. Issues with author name variations can affect the accuracy of the results.
- Scope of the Query: The initial query used to create the dataset will strongly influence the results. A different query could identify a different set of top authors.
- Missing Authors: There may be authors not in this list that are significant in the field, so more authors should be analyzed to get a complete overview.
In conclusion, this “Authors’ Production Over Time” plot provides a valuable overview of the key players and their contributions to the field of Circular Economy. By carefully examining the plot and considering the associated publication data, researchers can gain a deeper understanding of the field’s evolution, identify influential works, and potentially uncover promising areas for future research. Remember to consider the limitations of the data and analysis when interpreting the results.

Authors’ Local Impact

Most Relevant Affiliations

Affiliations’ Production over Time

Corresponding Author’s Countries
verall Interpretation
This plot reveals the leading countries in this research area based on the affiliations of corresponding authors in SCOPUS-indexed publications. It allows us to compare the research output of different countries and, crucially, to assess the degree to which that output is the result of purely domestic efforts (SCP) versus international collaboration (MCP). The MCP ratio gives a standardized measure of international engagement.
Key Observations and Discussion Points
1. Top Producers: Italy is the most productive country by a significant margin (123 articles), followed by Sweden (110 articles). It is important to note that we only have data on the top 20 countries in this specific collection. The actual number of articles for each country may be higher in the general database, and there could be other countries not included in this selection that have a significant number of publications.
2. Collaboration vs. Domestic Research: While Italy and Sweden have the highest total publications, it’s important to look at the balance between SCP and MCP. A higher proportion of SCP suggests a stronger domestic research capacity and infrastructure within that country *in this research area*.
3. International Collaboration Leaders: France stands out with a notably high MCP percentage (69.2%). Austria (64.3%) and Denmark (50%) and Netherlands (46.6%), China (47.4%) also show high rates. This suggests that research from these countries is often conducted in partnership with researchers from other nations.
4. Predominantly Domestic Research: Poland (5.6%), Greece (8.3%), India (13.8%), Germany (16%), and Norway (15.8%) have the lowest MCP percentages. This indicates that a larger proportion of their research in this dataset is conducted within the country, possibly reflecting national research priorities, funding structures, or collaboration patterns.
5. Germany’s Case: Germany has a relatively modest MCP ratio (16%) despite being a major research nation. This could indicate a strong focus on domestic research funding and infrastructure within this particular research area, or that its international collaborations are spread across a wider range of countries beyond the top collaborators in this specific dataset, or even that researchers residing in Germany are choosing to collaborate with other researchers in Germany.
6. Brazil: Brazil shows a substantial number of publications (65) with a relatively high MCP percentage (43.1%), suggesting a good balance between domestic research and international collaboration in this field.
7. United Kingdom: The UK shows a moderate number of articles (79) and MCP percentage (35.4%) which shows that they produce a decent amount of articles, and do collaborate internationally often.
Critical Discussion Points & Questions to Explore Further
- Database Bias: The analysis is based on SCOPUS data. Are there biases in SCOPUS coverage that might favor certain countries or types of publications (e.g., English-language journals)? Consider comparing this analysis with data from other databases like Web of Science or Google Scholar to assess the robustness of the findings.
- Field-Specific Collaboration Norms: Are there specific norms in this research area that influence collaboration patterns? Some fields naturally lend themselves to international collaboration (e.g., large-scale data collection, global health challenges).
- Funding and Policy: How do national research funding policies and international collaboration programs influence these patterns? Are there specific funding initiatives that encourage or discourage international collaboration in the countries with high or low MCP ratios?
- Authorship Conventions: How are corresponding authorships assigned in different countries and fields? Are there cultural or disciplinary differences in how authorship is attributed that might affect the results?
- Network Analysis: Complement this analysis with a network analysis of country co-authorship. This would reveal which countries are collaborating most frequently with each other.
- Temporal Trends: How have these collaboration patterns changed over time? Analyzing the MCP ratio for each country over different time periods would provide insights into evolving research collaborations.
- Impact of Collaboration: Does international collaboration lead to higher-impact publications (e.g., as measured by citations)? Compare the citation rates of SCP and MCP publications for each country.
In summary, this plot provides a valuable overview of research activity and collaboration patterns among the top contributing countries in this research area. By considering the balance between domestic and international research, and by critically evaluating potential biases and confounding factors, you can gain a deeper understanding of the dynamics of research in this field. Remember to supplement this analysis with additional data and qualitative insights to provide a more comprehensive interpretation.


Countries’ Production over Time

Most Cited Countries

Most Global Cited Documents

Most Local Cited Documents
Overall Observations & Key Takeaways:
- Geissdoerfer’s Work Dominates: The name Geissdoerfer appears multiple times, particularly with the 2017 *J Clean Prod* paper leading significantly in both local (LC = 341) and global citations (GC = 5183). This strongly suggests that Geissdoerfer is a key figure in this research area, and their work provides a foundational or highly influential perspective. The high LC confirms the author’s relevance to the topic covered by your specific collection.
- Journal Distribution: *Journal of Cleaner Production* (*J Clean Prod*) and *Business Strategy and the Environment* are frequently represented. This indicates that these journals are central venues for publishing research relevant to this particular research field (as captured in your collection).
- Recent Publications: The majority of articles are from 2016-2021. This suggests that the field you’re investigating is relatively active and evolving.
- Discrepancies Between Local and Global Citations: There is a variation in local versus global citation counts. This difference will be useful for identifying what articles are particularly relevant within your targeted field, but that has lower impact on broader contexts.
In-Depth Article Analysis:
Here’s a breakdown of some key articles and what their citation metrics might indicate:
- GEISSDOERFER M, 2017, J CLEAN PROD: This article has the highest LC (341) and GC (5183) by a significant margin. A high NLC (9.57) and NGC (12.94) further confirm its importance and influence, indicating that this article is not only frequently cited in general but also more often cited than other articles published in the same year. This is likely a cornerstone publication for the field. *Possible interpretation: This is a foundational paper, a review, or a methodological breakthrough that is frequently cited in research related to the focus of your collection.*
- BOCKEN NMP, 2016, J IND PROD ENG: The second highest locally cited article (LC=241), but the normalized citation count (NLC=3.62) is much lower than Geissdoerfer. This indicates that the paper is very relevant within the narrower field defined by your collection, but probably has a lower influence in other areas. *Possible interpretation: This paper addresses more technical challenges or regional contexts of the topic.*
- LINDER M, 2017, BUS STRATEGY ENVIRON: LC = 194, GC = 694. The moderate number of citations both locally and globally suggests a solid contribution with some recognition, without being a dominant publication. *Possible interpretation: Offers a well-regarded, though not groundbreaking, perspective that has resonated with both a specific and broader audience.*
- FERASSO M, 2020, BUS STRATEGY ENVIRON: This article stands out due to its relatively high NLC (31.27) compared to its NGC (4.61). A high NLC, despite the average NGC, suggests that this article has a strong resonance and relevance within the specific research focus of your collection, potentially addressing a niche or emerging aspect that is gaining traction locally but hasn’t yet achieved widespread global recognition. *Possible interpretation: It might be a methodologically novel contribution, a case study with specific insights, or address a newly emerging trend that’s highly relevant to the research area defined by your collection.*
- WHALEN KA, 2019, J CLEAN PROD: Lower citations across the board (LC=37, GC=87, NLC=4.04, NGC=0.92), indicates a more niche contribution. *Possible interpretation: It could be focused on a specific methodology, a narrow case study, or a preliminary exploration of a concept that hasn’t yet gained mainstream attention.*
Recommendations for further analysis and discussion:
1. Content Analysis: Conduct a content analysis of the most highly cited articles (especially Geissdoerfer’s) to identify the core themes, methodologies, and theoretical frameworks that underpin the field. What are these authors arguing? What methods are they using?
2. Citation Network Analysis: Explore the citation relationships between these articles. Who is citing whom? Are there distinct clusters of research within your collection? This can reveal intellectual lineages and key debates within the field.
3. Keyword Analysis: Analyze the keywords associated with these articles to identify the dominant concepts and research areas. This can complement the content analysis and provide a broader overview of the field.
4. Temporal Trends: Examine how citation patterns have evolved over time. Are there certain periods when specific articles or themes gained prominence? This can shed light on the development of the field.
5. Compare NLC and NGC: Use the difference between the NLC and NGC to determine if some recent articles are gaining relevance on a local scale, perhaps indicating an emerging trend.
By combining these quantitative insights with qualitative analysis, you can develop a more comprehensive understanding of your research area and the key contributions that have shaped its development. Remember to relate your findings back to the specific research question or topic that motivated your collection.

Most Local Cited References

Reference Spectroscopy

Most Frequent Words

WordCloud

TreeMap

Words’ Frequency over Time

Trend Topics
Overall Trends:
- Focus on Sustainability and Circularity: The plot clearly indicates an increasing focus on sustainability-related topics in recent years. Terms like “circular economy,” “circular business model,” and “sustainable development” emerge as prominent trends, particularly around 2023. This aligns with a broader global movement towards environmentally conscious business practices.
- Business and Economic Context: Alongside sustainability, there’s a strong presence of business-related terms. “Business models” is a significant trend, and terms like “economic analysis,” “business modeling,” and “competition” suggest a focus on the economic dimensions of the research area.
- Industry Specific Trends: Terms like “construction industry”, “textile industry” and “supply chain management” appear on the graph. It could indicate a rising research interest in sustainability or some type of transformation specific to these sectors.
- Early Concepts (Product-Service Systems): Terms like “productservice system (pss)” and “closed loops” appear earlier in the time series (around 2017-2019), which probably indicates that these terms have been discussed for longer. The decline in prominence may mean the concepts have become more mainstream and are now integrated into broader areas like circular economy.
Specific Observations and Potential Interpretations:
- “Circular Economy” and Related Terms: The high frequency of “circular economy,” “circular business model” in recent years suggests a concentrated research effort in this area. Researchers are likely exploring and defining circular economy concepts and frameworks.
- The Interplay of Sustainability and Business: The concurrent presence of “sustainable development” and “business models” points to research investigating how sustainable practices can be integrated into business strategies. This suggests an interest in the economic viability of sustainability initiatives.
- Shift from “Product-Service System” to “Circular Economy”: The movement from “productservice system (pss)” to “circular economy” might indicate an evolution in the way researchers frame sustainable business models. Product-service systems might now be viewed as a component or strategy within the broader context of a circular economy.
Further Analysis Considerations:
- Database Context: The fact that the data is from Scopus is important. Scopus covers a wide range of academic disciplines, but it may have biases towards certain fields or regions.
- Keyword Selection: The analysis is based on the “KW\_Merged” field. Understanding how these keywords were merged and selected is crucial. The results are based on the keywords supplied by the authors.
- Qualitative Analysis: To gain a deeper understanding of the trends, consider a qualitative analysis of the documents associated with the key terms. Examining the titles, abstracts, and even full texts will provide more context.
- Comparative Analysis: Compare these trends with other datasets or databases to see if similar patterns emerge.
In summary, this trend topics plot suggests a strong and growing interest in sustainability and circular economy, particularly in relation to business and economic models. Furthermore, specific sectors are also discussed in this area. It also shows the interest in PSS and closed loops has faded slightly. Further investigation is needed to understand the specific research questions and challenges being addressed within these areas.

Co-occurrence Network
Overall Structure:
The network visually presents itself as two distinct clusters or communities, indicated by the red and blue node colors. This suggests two relatively separate, but connected, areas of focus within the dataset. The size of the nodes indicates the frequency of the keywords, and the edges represent the strength of their co-occurrence within the Scopus collection. The larger the node, the more frequently the keyword appears.
Community 1 (Red Nodes): Business Model & Innovation
This cluster contains terms like:
* “life cycle assessment” and “life cycle analysis”
* “innovation”
* “business development”
* “supply chain management”
* “stakeholder”
* “environmental impact”
* “environmental economics”
* “conceptual framework”
* “economic aspect”
The presence of terms like “life cycle assessment,” “environmental impact,” and “environmental economics” indicates a focus on sustainability assessments and environmental considerations within a business context. “Supply chain management” and “stakeholder” point to the importance of considering the broader network of actors involved in the value chain and their respective roles.
Community 2 (Blue Nodes): Circular Economy
This cluster is prominently centered around the term “circular economy”, which is the most connected and biggest node. Other important nodes include:
- “business models” and “circular business model”
- “sustainability”
- “sustainable development”
- “climate change”
- “digital technologies”
- “textile industry”
- “fashion industry”
- “reuse”
- “product-service systems”
The terms in this cluster clearly indicate a strong focus on circular economy principles, business models adapted for circularity, and sustainability. The presence of terms like “textile industry” and “fashion industry” suggests that this cluster has literature examining applying circular economy principles specifically to these sectors. “Digital technologies” indicates that the role of technology in enabling or facilitating the circular economy is also a relevant topic within this research area.
Key Observations and Interpretations:
- Centrality of Circular Economy: The “circular economy” node is the most prominent, indicating that it is the core concept linking many of the research themes together. Its large size reflects the importance of this term in the corpus.
- Relationship Between Communities: The connection between the two communities reveals that while “circular economy” is the core, the red community focuses on the business side of things.
- Parameter Impact: The “normalize: association” parameter would have strengthened strong associations and weakened less frequent co-occurrences. The Walktrap clustering algorithm is good at finding natural communities, so this is good to keep in mind when interpreting community membership.
Suggestions for further analysis and exploration:
- Temporal Trends: Investigate how the co-occurrence patterns have changed over time. Are “circular economy” and related terms becoming more dominant in recent years?
- Author/Country Analysis: Examine the network from the perspective of different authors or countries to understand the geographic distribution of research activity in these areas.
- Document Analysis: For specific keywords of interest, retrieve and analyze the underlying documents to gain a deeper understanding of the specific contexts in which these terms are used together.
I hope this helps in interpreting the network. If you have more questions just ask!

Thematic Map
Overall Structure
The strategic map is a two-dimensional plot. The axes represent:
- X-axis (Relevance Degree/Centrality): This axis indicates the *importance* or *influence* of a research area within the field. Higher centrality suggests the theme is more strongly connected to other themes and is a key area of research.
- Y-axis (Development Degree/Density): This axis indicates the *maturity* or *level of development* of the research area. Higher density suggests a well-established and actively researched theme.
The map is divided into four quadrants, each representing a different type of theme:
- Motor Themes (Upper Right): High centrality and high density. These are the dominant, well-developed, and important research areas.
- Niche Themes (Upper Left): Low centrality but high density. These are specialized or emerging areas with a dedicated research community, but not yet broadly influential.
- Basic Themes (Lower Right): High centrality but low density. These are fundamental areas of importance, but may be less actively researched or perhaps broader in scope.
- Emerging or Declining Themes (Lower Left): Low centrality and low density. These are areas that are either just starting to gain attention or are losing relevance.
Cluster Descriptions and Interpretation
Based on the provided data and the map, here’s an interpretation of each cluster:
* Sustainable Development (Motor Theme):
* Position: Upper right quadrant, indicating high centrality and high density.
* Keywords: sustainable development, recycling, waste management
* Key Articles:
* VAN OPSTAL W, 2025, RESOUR, CONSERV RECYCL ADV
* NUßHOLZ JLK, 2019, RESOUR CONSERV RECYCL
* RIZOS V, 2024, RESOUR CONSERV RECYCL
* Interpretation: This is a core, well-established, and influential area of research. The focus on “resource conservation and recycling” alongside “sustainable development” suggests a strong emphasis on resource efficiency and waste reduction strategies within the broader sustainability field. The presence of highly-cited articles from journals like *Resource, Conservation & Recycling* reinforces this. The dates of the articles (2019, 2024, 2025) indicate ongoing and recent research activity.
* Life Cycle (Located centrally):
* Position: Located centrally, it could be considered as a cross-cutting theme connecting different areas.
* Keywords: life cycle, supply chains, product design
* Key Articles:
* MERLI R, 2018, J CLEAN PROD
* MAHL T, 2023, PROC DES SOC
* CENTOBELLI P, 2022, CURR OPIN GREEN SUSTAIN CHEM
* Interpretation: This cluster acts as a bridge between various sustainability concepts. The inclusion of “supply chains” and “product design” along with “life cycle” suggests a focus on analyzing the environmental and economic impacts of products and services throughout their entire life cycle, from raw material extraction to end-of-life management. The journals involved such as *Journal of Cleaner Production* and *Current Opinion in Green and Sustainable Chemistry* emphasize the field’s focus on integrating sustainability into industrial processes and product development.
* Circular Economy (Basic Theme):
* Position: Lower right quadrant, indicating high centrality but lower density.
* Keywords: circular economy, business models, circular business model
* Key Articles:
* SJÖDIN D, 2023, TECHNOL FORECAST SOC CHANGE
* KATSANAKIS N, 2023, SUSTAIN PROD CONSUM
* DAHMANI N, 2021, J CLEAN PROD
* Interpretation: The circular economy is identified as a central theme, especially revolving around business models. This suggests the importance of circular economy strategies within the research area. However, its lower density suggests the area may still be developing or is perhaps a broader concept with diverse applications, and its development might be slower compared to Sustainable Development. Journals like *Technological Forecasting and Social Change, Sustainable Production and Consumption, and Journal of Cleaner Production* demonstrate the intersection of technological innovation, sustainable practices, and production/consumption patterns within the circular economy.
* Business (Emerging or Declining Theme):
* Position: Lower left quadrant, indicating low centrality and low density.
* Keywords: business, innovation, business development
* Key Articles:
* CHIAPPETTA JABBOUR CJ, 2020, J ENVIRON MANAGE
* BOCKEN N, 2022, TECHNOL FORECAST SOC CHANGE
* ZHANG B, 2025, SUSTAINABILITY
* Interpretation: This cluster is in the “emerging or declining” quadrant, suggesting it is either a relatively new area or one that is losing momentum within the overall research landscape. Given the keywords “business innovation” and “business development,” this might indicate that the specific intersection of these business-related concepts with the broader research area needs further exploration to gain more prominence. The presence of articles from *Journal of Environmental Management* and *Sustainability* implies some connection to broader environmental and sustainability issues.
* Electric Vehicles (Niche Theme):
* Position: Upper left quadrant, indicating low centrality but high density.
* Keywords: electric vehicles, second life, electric vehicle
* Key Articles:
* CHIRUMALLA K, 2024, IFIP ADVANCES IN INFORMATION AND COMMUNICATION TECHNOLOGY
* CHIRUMALLA K, 2024, IFIP ADVANCES IN INFORMATION AND COMMUNICATION TECHNOLOGY-a
* CHIRUMALLA K, 2024, TECHNOL FORECAST SOC CHANGE
* Interpretation: Electric vehicles are positioned as a niche theme, suggesting that while it’s a densely researched area (high density), it’s not as centrally connected to the other themes as, say, sustainable development or circular economy (low centrality). The “second life” keyword suggests a focus on extending the use of EV batteries or components, which is a relevant area for sustainability. The journal sources, including *IFIP Advances in Information and Communication Technology* and *Technological Forecasting and Social Change*, indicate the intersection of technology, information systems, and future trends in the context of electric vehicles. The fact that the same author (Chirumalla K) has multiple publications from 2024 in this cluster suggests a focused research effort.
Overall Interpretation and Potential Insights
- Core vs. Peripheral Themes: The map highlights the dominance of “Sustainable Development” as a central and well-developed theme. Other themes like “Circular Economy” and “Life Cycle” play important but different roles in the research landscape.
- Interconnections: The central position of “Life Cycle” suggests it may act as a linking pin between other themes. Further analysis of co-citations between the “Life Cycle” cluster and other clusters could reveal valuable insights into these connections.
- Emerging Opportunities: scopu Investigating how these themes can be more closely integrated with the core themes of “Sustainable Development” and “Circular Economy” could be fruitful. For instance, exploring innovative business models for circular economy in the electric vehicle sector could bridge these areas.
- Temporal Trends: Pay attention to the publication years of the key articles. Are there any noticeable shifts in research focus over time? This could indicate evolving priorities and emerging trends within the field.
- Journal Representation: The journal distribution within each cluster provides insights into the disciplinary focus of the research. Are there interdisciplinary connections? Are certain journals more dominant in specific areas?
- Limitations: Remember that this analysis is based on keyword co-occurrence and the specific parameters used (e.g., `minfreq`, `cluster`). Different parameter settings could yield different results. Furthermore, the strategic map represents a snapshot in time. The research landscape is constantly evolving, so it’s important to revisit this analysis periodically to track changes and emerging trends.
Next Steps for the Researcher
1. Dive Deeper into Key Articles: Read the key articles identified in each cluster to understand the specific research questions, methodologies, and findings.
2. Explore Co-citations: Analyze the co-citation patterns between articles in different clusters to identify stronger connections and knowledge flows.
3. Refine Search Strategies: Use the insights from this analysis to refine search strategies and identify relevant literature that might have been missed.
4. Consider Alternative Clustering Methods: Experiment with different clustering algorithms and parameter settings in Biblioshiny to see how the thematic landscape changes.
5. Qualitative Analysis: Complement this quantitative analysis with a qualitative review of the literature to gain a deeper understanding of the nuances and complexities of each theme.
6. Further investigate Business and Electric Vehicle themes: These themes could be further explored. Why is business so low? Is it because of a different search query would have been more adapted? Similarly, is there a way to make the electric vehicle themes more central?
By carefully interpreting the strategic map and considering these additional steps, you can gain a more comprehensive understanding of the research landscape and identify opportunities for future contributions.

Factorial Analysis
Overall Structure and Interpretation
This factorial map, generated using Multiple Correspondence Analysis (MCA) on Scopus data, visualizes relationships between keywords (“KW_Merged”) within your research collection. The map’s dimensions represent underlying themes or aspects of the research field.
- Dimension 1 (61.97%): This dimension explains the majority of the variance in the data. Based on the terms positioned along this axis, it seems to represent a spectrum from applied business practices (left side) to more theoretical/outcome-oriented research (right side). Think of it as a gradient from “doing” to “understanding/analyzing.”
- Dimension 2 (15.18%): This dimension captures a smaller, but still significant, amount of variance. The terms suggest a distinction between sustainability and high-level strategic topics (top of the map) versus more focused operational or innovation approaches (bottom).
Cluster Identification and Thematic Interpretation
The map exhibits a few distinct clusters. Let’s analyze them:
1. Sustainability and Lifecycle Cluster (Upper-Left): Terms like “economic and social effects”, “life cycle”, “life cycle assessment”, “industrial economics” and “product design” form a cluster. This suggests a research focus on assessing the sustainability and broader implications of products, processes, or policies.
2. Business Model Cluster (Center-Left): Terms such as “fashion industry”, “business models”, “sustainable development”, “value creation”, “economic analysis”, “circular business model”, and “supply chain management” indicate research related to designing and implementing sustainable and value-driven business models across various industries.
3. Manufacturing and Innovation Cluster (Lower-Left): Keywords like “manufacturing”, “literature review”, “business”, “environmental economics”, “innovation”, “strategic approach”, and “conceptual framework” show a focus on strategic and innovative business practices.
4. Article and Commercial Cluster (Far-Right): The terms “article” and “commercial phenomena” are quite separated from the other clusters. This could indicate research focused specifically on analyzing articles as a unit or understanding the commercial aspects of the research area. Its distance from other clusters suggests it is a distinct area within the collection.
Key Contributing Terms
- High Positive on Dimension 1 (“Commercial Phenomena/Article”): This means that documents associated with these keywords are different from the others in your collection.
- High Positive on Dimension 2 (“Economic and Social Effects”): This highlights the importance of research focusing on the wider societal consequences of business decisions.
- High Negative on Dimension 2 (“Conceptual Framework”): This points to the relevance of developing robust frameworks for analysis within this research area.
Interpretation & Discussion Points for Your Research
1. Focus Areas: Your research collection appears to be heavily focused on sustainability-driven business models and the assessment of life cycles/environmental impact. It shows a clear connection between theory and practice.
2. Research Gaps: Consider whether the emphasis on sustainability may overshadow other important business aspects (e.g., pure profit maximization, disruption).
3. Cross-Cluster Relationships: Explore the relationships between these themes. For example, how are manufacturing and innovation (Cluster 3) being integrated with sustainable business models (Cluster 2)?
4. Outlier Analysis: The “article/commercial phenomena” cluster needs further investigation. Why are these terms separated? Are they indicative of a separate body of research, or are they perhaps methodologically different?
5. Database Effects: Remember this is based on *Scopus* data. This database has biases in terms of journal coverage. Consider if this might skew the representation of the field.
Next Steps
- Examine the *documents* associated with the most extreme keywords on each dimension to gain a deeper understanding of the underlying themes.
- Compare this map to similar analyses run with different parameter settings (e.g., different `minDegree` values, different `field` options) to test the robustness of these findings.
- Use this map as a starting point for further investigation of the intellectual structure of your research area.
By considering the structure of the map, the positions of key terms, and the cluster formations, you can begin to understand the intellectual landscape of the research represented by your Scopus collection. Remember that this map is just one tool, and should be used in conjunction with other analyses and your own expert knowledge of the field.

Co-citation Network
Overall Structure:
The network shows a clear bipartite structure, with two distinct clusters (highlighted in blue and red) that represent different, yet interconnected, areas of research. The presence of gray lines connecting the two clusters indicates that there is some overlap and cross-citation between these areas. This could suggest that these are related subfields within a broader research domain, or that one field is drawing on the other.
Community Detection (Walktrap Algorithm):
The Walktrap algorithm identified these communities based on the patterns of citation. The colors help visualize the different “walks” or paths that citations tend to follow, thus revealing these clusters of highly co-cited papers.
Key Observations and Interpretations:
- Community Separation: The distinct communities likely represent different schools of thought, research methodologies, or sub-topics within the broader field covered by your SCOPUS dataset. The separation suggests that researchers within each cluster cite each other more frequently than they cite researchers in the other cluster.
- Nodes with High Degree (Size): The nodes with larger sizes represent publications that are cited most often in conjunction with other publications in the network. These are central papers that have significantly influenced research in these areas. For example, the nodes like *Osterwalder & Pigneur 2010*, and *Kirchherr et al 2017* appear as particularly influential due to their larger size.
- Interconnecting Edges: The gray edges connecting the two clusters are crucial. They point to intellectual bridges between the fields. Publications cited in both communities are likely playing a key role in integrating the two areas.
Interpreting the Most Connected Terms (Labels):
- Osterwalder & Pigneur (2010): This is a highly cited work. Given its size and central location, it is likely a foundational text for the whole network.
- Kirchherr et al (2017): This publication is strongly represented in both communities, indicating its importance and relevance to both research areas.
- Ghisellini et al (2016): It is also represented in both communities, indicating its importance and relevance to both research areas.
- Lewandowski (2016): This publication is strongly represented in both communities, indicating its importance and relevance to both research areas.
Actionable Insights and Further Investigation:
1. Examine the Content: Read the most highly cited publications (especially those with the largest node sizes). What are their key arguments, methodologies, or findings? Understanding these core publications is critical for understanding the entire network.
2. Compare the Communities: Analyze the keywords and abstracts of the publications in each cluster. What are the key differences in focus, methodology, or theoretical perspectives between the two communities? This will give you a better understanding of what distinguishes them.
3. Investigate the Bridging Publications: Focus on the publications that connect the two clusters. What concepts or ideas are these publications using to bridge the gap between the two communities?
4. Temporal Trends: Consider the publication years. Are there any trends in the timing of citations? For example, did one community emerge earlier than the other?
Critical Considerations:
- Database Bias: The analysis is based on SCOPUS data. Results might be different if you used Web of Science, Google Scholar, or other databases.
- Co-citation vs. Influence: Co-citation does not necessarily imply direct influence. Two papers may be co-cited because they are both addressing a similar topic, even if one doesn’t directly build upon the other.
- Parameter Sensitivity: Changing the parameters used to generate the network (e.g., `community.repulsion`, `edges.min`) could alter the appearance and interpretation of the network.
By carefully examining the content of the key publications and understanding the relationships between the communities, you can gain valuable insights into the structure and evolution of this research area. Let me know if you’d like help in narrowing down the most important publications based on these criteria.

Historiograph
Overall Observations:
- Temporal Span: The network covers publications from 2016 to 2021, indicating a relatively recent but rapidly evolving field.
- Key Authors: Geissdoerfer and Bocken appear to be central figures, with their earlier works significantly influencing subsequent research.
- Citation Clusters: The network appears to be evolving around the core of conceptual papers toward empirical studies and applications.
Detailed Analysis by Temporal Stages:
2016-2017: Conceptual Foundations
* Pivotal Works:
* Bocken NMP, 2016: Closing The Circle: This paper appears to be one of the foundational works, likely providing an early definition and framework for circular economy concepts.
* Geissdoerfer M, 2017: A Conceptual Framework For Circular Design: This publication builds upon the earlier work, providing a framework specifically for circular design, indicating a move towards practical application of circular economy principles.
* Linder M, 2017: The Circular Economy – A New Sustainability Paradigm?: This suggests that early research was also focused on defining and positioning the circular economy in relation to broader sustainability paradigms.
2018-2019: Business Models and Implementation
* Emerging Themes: The network expands to include papers focusing on:
* Business Model Innovation: Several papers explore the design and experimentation of circular business models (e.g., Geissdoerfer, 2018; Frishammar, 2019; Whalen, 2019; Zucchella, 2019; Bressanelli, 2019). This suggests a shift towards understanding how companies can practically adopt circular economy strategies.
* Specific Industries and Applications: Research starts to focus on specific industries, such as clothing retail (Frishammar, 2019), electric vehicle batteries (Bressanelli, 2019), and the washing machine industry (Antikainen, 2018).
* The Role of Technology: Papers like Veleva (2018) explore the role of digital technologies in enabling circular economy.
* Regional and Economic Considerations: Works like de Angelis (2018) examine the economic sustainability of circular economy models at a regional level.
* Literature Reviews and Redefinitions: Vermunt (2019) indicates a growing need to synthesize and redefine the expanding body of knowledge in the field.
2020-2021: User Behavior and Long-Term Sustainability
* Evolving Focus:
* User-Centric Design: Ferasso (2020) highlights the importance of considering user behavior in circular design, indicating a more mature understanding of implementation challenges.
* Long-Term Sustainability: Kanda (2021) focuses on long-term sustainability from a recycling perspective, suggesting a growing concern for the environmental impacts and resource efficiency of circular economy practices over time.
* Collaboration: Hofmann (2020) emphasizes collaboration within circular business models, highlighting the social dimension of circular economy.
Interpretation and Critical Discussion:
1. Maturation of the Field: The historiograph shows a clear progression from initial conceptualization (2016-2017) to practical application and industry-specific studies (2018-2019), and finally towards considerations of user behavior and long-term sustainability (2020-2021).
2. Core Concepts and Divergence: Early works by Bocken and Geissdoerfer set the stage for the field, but subsequent research has branched out into diverse areas, reflecting the multifaceted nature of the circular economy.
3. Research Gaps: While the network shows increasing interest in business models and implementation, there might be a need for more research on:
* Scaling Strategies: How to scale circular economy initiatives beyond niche applications.
* Policy and Regulation: The role of government policies in promoting and regulating circular economy practices.
* Social Equity: Ensuring that circular economy transitions are equitable and benefit all stakeholders.
Conclusion:
This historiograph provides a valuable overview of the intellectual development of the circular economy research field. It highlights the key publications, authors, and thematic areas that have shaped the field, as well as potential areas for future research. Further analysis, perhaps incorporating co-citation analysis or keyword analysis, could provide even deeper insights into the structure and dynamics of this evolving field.

Collaboration Network
Overall Structure:
The network appears to be fragmented, with several distinct clusters (communities) and a few isolated nodes. This indicates that while collaboration exists within certain groups of authors, there isn’t widespread collaboration across the entire research field represented by this dataset. The network structure suggests that the field might be composed of relatively distinct sub-disciplines or research groups that operate somewhat independently.
Communities (Clusters):
The ‘walktrap’ clustering algorithm has identified several communities, visualized with different colors. Let’s examine these:
- Purple Cluster (prominent: Bocken n, Bocken nmp, Konietzo, Antikainen m, Van opstal w, Baldassarre): This is a relatively large and densely connected cluster. The strong connections between these authors likely signify a closely collaborating research group or a leading group within a particular subfield. The prominence of “Bocken n” suggests that this author might be a central figure in this cluster, potentially a senior researcher or project lead. The presence of Konietzo, Antikainen m, Van opstal w and Baldassarre suggests that the collaboration theme is shared research interest.
- Green Cluster (Kumar m, Evans s, Geissdoerfer m, Kanda w, Kirchner j): This is another significant cluster, but less densely connected than the purple one. It suggests collaborations amongst “Kumar m, Evans s, Geissdoerfer m, Kanda w, Kirchner j,”. The dotted link between Kirchherr j and Urbinti a suggest only a weak collaboration between these two researchers/clusters.
- Orange Cluster (Urbinti A, Aarikka-stenroos I, Chiaroni D): This is a smaller cluster, meaning collaboration occurs between a smaller group of researchers, specifically, “Urbinti A, Aarikka-stenroos I, Chiaroni D”.
- Pink Cluster (Piekarski cm, De francisco ac): A small, tightly-knit cluster, indicating close collaboration between these two authors.
- Red Cluster (Mendoza jmf, Charnley f, Moreno m, Pigosso dca): This is a very small cluster of researchers.
- Blue cluster (Riel hidalgo-crespo j): This isolated cluster means that the researchers named: Riel hidalgo-crespo j are not collaborating with other researchers in this network, based on the parameters set.
- Brown Cluster (Bressanelli Perona m, Saccani N): A small, tightly-knit cluster, indicating close collaboration between these two authors.
- Gray Cluster (Chirumalla Ak): This isolated cluster means that the researcher named: Chirumalla Ak are not collaborating with other researchers in this network, based on the parameters set.
Most Connected Authors and Relevance:
The node size indicates the degree of each author (number of co-authors). Larger nodes mean the author has more connections, which means they collaborate more frequently.
In this network, “Bocken n” appear to be the most connected.
Overall Interpretation & Discussion Points:
- Fragmented Collaboration Landscape: The separation into distinct clusters indicates that the research field, as captured by this SCOPUS dataset, isn’t a single unified entity. Instead, it consists of different research groups or sub-disciplines that primarily collaborate internally.
- Potential for Interdisciplinary Work: The limited connections *between* clusters suggest an opportunity for more interdisciplinary research. Investigating the research topics of the different clusters and identifying common ground could be valuable.
- Impact of “Bocken n”: The central role of “Bocken n”, based on node size and position within its cluster, may be crucial for future projects/studies.
- Consider Further Analysis: It would be beneficial to conduct a content analysis of the publications associated with each cluster to understand the specific research topics driving the collaboration. Are the clusters focused on different methodologies, geographical regions, or application areas?
- Database Coverage: Remember that this analysis is based on a SCOPUS download. SCOPUS has specific coverage characteristics, so the results might not be fully representative of the entire field. Consider comparing with other databases (Web of Science, etc.) for a more comprehensive view.
- Parameter Sensitivity: The parameters used to generate the network (normalization, clustering algorithm, etc.) can influence the results. Experimenting with different parameters could reveal alternative network structures. For instance, increasing the `community.repulsion` parameter might spread out the clusters more, potentially revealing weaker connections.
By considering these points, you can use this collaboration network to gain valuable insights into the structure and dynamics of the research field represented by your SCOPUS dataset. You can then use these insights to inform your own research, identify potential collaborators, and understand the broader context of your work.

Countries’ Collaboration World Map
Key Observations:
* Major Scientific Production Hubs: The map clearly highlights the United States, Europe (especially Western and Northern Europe), China, and Australia as major hubs of scientific production. This is evident from the darker blue shading, indicating higher research output compared to other regions. Brazil shows a relatively strong color intensity in South America, suggesting a significant contribution from this region.
* Key International Partnerships: The network of lines connecting countries reveals patterns of collaboration.
* Transatlantic Collaboration: Strong lines between the US and Europe, particularly Western Europe, indicate a robust transatlantic research collaboration.
* Intra-European Collaboration: There is a dense network of connections within Europe, pointing to strong collaborative ties among European countries.
* Collaboration with China: Connections between China and the US, Europe, and Australia signify the growing importance of China in international scientific collaborations.
* Southern Hemisphere Connections: The lines between the Northern and Southern hemisphere suggest collaborations between the strongest countries in the Northern and Southern parts of the world.
* Global Patterns of Collaboration:
* Concentration in Developed Economies: Scientific collaboration appears to be largely concentrated among developed economies, particularly those in North America, Europe, and the Asia-Pacific region.
* Potential Under-Representation of Developing Nations: While some developing countries, such as Brazil, participate in the global research network, the overall color intensity suggests that many others might be under-represented in terms of research output and international collaboration.
* Data Source Consideration: Because the data was gathered from SCOPUS, there could be a bias towards English-language publications and publications from certain regions that are more heavily indexed in SCOPUS.
Interpretation and Critical Discussion:
1. Dominance of Established Scientific Powers: The map reaffirms the dominance of the US and Europe in global scientific production. This could be attributed to factors like higher research funding, well-established research infrastructure, and historical advantages in scientific development.
2. Rise of China as a Scientific Power: The strong collaborative links involving China signal its increasing prominence and influence in global science. This is likely due to its substantial investments in research and development, coupled with a growing pool of researchers.
3. Impact of Funding and Infrastructure: The concentration of research output in developed countries suggests the critical role of research funding and infrastructure in fostering scientific productivity and international collaboration. Countries with limited resources might face barriers to participating in the global research network.
4. Geopolitical Influences: The patterns of collaboration might also reflect geopolitical relationships and historical ties. For example, the strong transatlantic collaborations could be linked to long-standing diplomatic and cultural connections.
5. Limitations and Biases: It’s crucial to acknowledge potential biases in the data. SCOPUS, while a comprehensive database, might not cover all scientific publications, particularly those in languages other than English or from less-developed regions. This could lead to an underestimation of research output and collaboration from these areas. Also, this analysis is based solely on co-authorship, not the extent or quality of collaboration. It provides an overview of the collaborations on an article level.
Further Investigation:
- Specific Disciplines: To gain a more nuanced understanding, it would be useful to analyze collaboration patterns within specific disciplines.
- Temporal Trends: Examining how collaboration patterns have evolved over time could reveal emerging trends and shifts in the global research landscape.
- Citation Analysis: Analyzing citation patterns could provide insights into the impact and influence of collaborative research.
- Qualitative Analysis: Complementing the bibliometric analysis with qualitative studies, such as interviews with researchers, could offer deeper insights into the motivations, challenges, and benefits of international collaboration.
In summary, this “Countries’ Collaboration World Map” offers a valuable overview of global scientific collaboration patterns, highlighting major hubs, key partnerships, and potential disparities. However, it’s essential to interpret the results critically, considering data limitations and potential biases, and to complement the analysis with further investigation.
